

I am going to switch gears from my recent articles and take a macro view of some trends in various fantasy categories. It’s a nice change of pace for a series of offseason articles to help us get ready for next year and view the fantasy landscape through a different lens.
I will first review various stats from a high-level perspective and then break them down into more detail. While I can analyze data in plenty of different ways, I always prefer a top-down approach, peeling back the layers as we go. To be clear, this isn’t a set of rankings or a cheat sheet. I am not telling you who to draft or avoid. It’s a macro view of the category.
Let’s start off with one that we all like: power. Yeah, it’s a good one. We all chase it. We can never have enough of it.
I am going to go back six years so we can compare 2026 to 2025 and to the six-year mean.
League HRs

Yes, league-wide HRs were down in 2026, but only fractionally (1.3% below 2025 and 0.8% below the six-year mean). Although 2021 and 2023 were higher, league-wide power did not change much across the six seasons. Well, that’s great, but it certainly felt like a drop-off, didn’t it? I guess it could depend on who you drafted.
HR Tiers
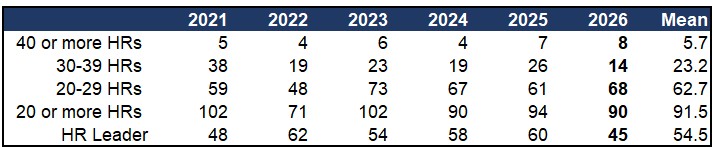
The table above reflects how many hitters finished a season in each HR range over the last six seasons. Each hitter is counted in only one of the top three rows. The 20 or more HRs row combines those first three groups.
While total HRs and the number of players hitting 20 or more HRs were essentially flat, the distribution of power changed within the tiers, especially in the 30-39 HR group. Power is becoming more concentrated in the 20-29 HR bucket, as you might expect. I mean, hitting 37 HRs is much different than hitting 24 (ask anyone who owned Gunnar to confirm).
Surprisingly, hitters with 40 or more HRs reached a six-year high of eight in 2026, while hitters with 30 to 39 HRs fell to 14, the lowest mark of the past six seasons. That 30-39 group has been shrinking and saw the largest decline over the six seasons (more on this later).
There were 22 hitters with 30 or more HRs in 2026 (the 40+ and 30-39 rows combined). That is in line with 2024, but 33% below 2025 and 24% below the six-year mean of roughly 29.
The eight 40-HR hitters were bunched between 41 and 45: Pete Crow-Armstrong and Kyle Schwarber (45), Pete Alonso (43), Yordan Alvarez and Junior Caminero (42), and Matt Olson, Hunter Goodman, and Ben Rice (41). The league-leading total of 45 HRs is the lowest of the last six seasons. Nothing against PCA or Schwarbs, but we had some big years recently with the Big Dumper and Judge reaching 60.
Repeat vs New
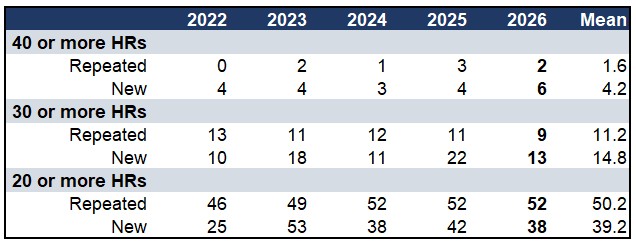
Repeated means the hitter reached the mark this season and the season before. New means he reached it this season but not the previous season. The groups overlap. Do not add the rows from different groups together. Note that 2021 is excluded from this table because the shortened 2020 season would skew year-over-year comparisons.
So, how do we interpret this data? This is not a test, but we already know the number of hitters who reach 20 or more HRs has been fairly stable (Hint 1: look at the HR Tiers table, not this one, the one above it). We also know the number of repeaters is fairly consistent overall (Hint 2: look at the Repeated rows in the table in this section), though the specific names continue to rotate. Expect new names every year, as roughly four in ten 20+ HR hitters are new to the group each season (38 of 90 in 2026).
The number of 20-HR repeaters was exactly 52 in 2024, 2025 and 2026. That’s pretty random and I checked. It’s purely a coincidence: the starting groups differed, so the repeat rate was 51% in 2024, 58% in 2025 and 55% in 2026. Only 24 hitters repeated in all three years (Stay with me — this is important, because it obviously gets harder to repeat as the bar gets higher).
30 or More HR Tier
Only nine of the 33 hitters (27%) who reached 30 HRs in 2025 repeated in 2026. The nine repeaters were Pete Alonso, Junior Caminero, Pete Crow-Armstrong, Rafael Devers, Hunter Goodman, Brandon Lowe, Shohei Ohtani, Kyle Schwarber, and James Wood. In fact, if you total the 30-HR seasons from 2021 to 2025, 56 out of 151 hitters repeated (37%). That means there’s a 63% probability that a 30-HR hitter fails to reach 30 again the following season. And before you ask, 2026 isn’t in the denominator; we can’t evaluate those repeats until 2027. The annual repeat rate ranged from 27% to 48%. 2026 was the lowest of the five-year sample. That’s a bummer, but the numbers tell the story.
Some of the usual suspects missed the cut due to reduced playing time. Ten of the 24 players who fell out of the 30-HR group had under 500 PAs, mostly due to injuries (Aaron Judge and Juan Soto among them). The other 14 reached 500 PAs. Injuries played a part, but a large chunk of hitters had disappointing seasons (I’m being polite here, insert expletive or appropriate adjective if you had any of these guys). That list includes Jo Adell (37 to 23 HRs), Michael Busch (34 to 20 HRs), Cal Raleigh (60 to 23 HRs), Julio Rodriguez (32 to 22 HRs), and Taylor Ward (36 to 7 HRs, double-yew-tee-eff). That was painful to write.
Thirteen hitters reached 30 HRs in 2026 after failing to do so in 2025, and the biggest percentage jumps came from Yordan Alvarez (who hit just 6 HRs in 2025!), Sal Stewart (5 to 32), Nolan Arenado (12 to 30), Miguel Vargas (16 to 33), Luis Garcia Jr. (16 to 30), and CJ Abrams (19 to 33). Newcomers with no 2025 reference point are Munetaka Murakami and Kazuma Okamoto.
40 or More HR Tier
The 40-or-more-homer group also turns over. Only two of the seven hitters with 40 or more HRs in 2025 did it again. Six of the eight in 2026 were new, the most in the last five years. The two repeaters are Junior Caminero and Kyle Schwarber.
Power and Average
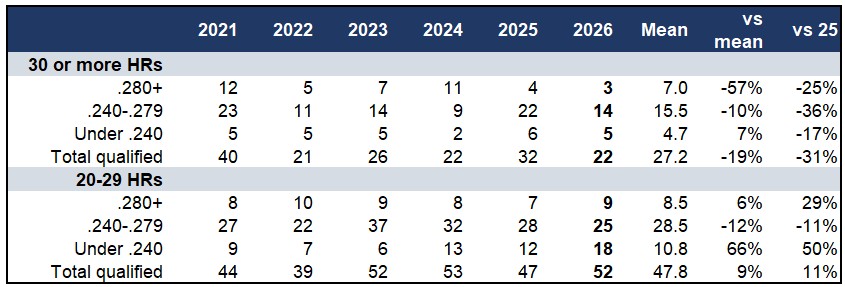
Qualified means 502 or more PAs, the batting title minimum. Hitters under 502 PAs are not in the table, so total qualified is lower than in previous HR tables. League batting average ranged from .243 to .248 over the period, with a mean of .245. I chose .240 as the cutoff because it is below the league average every year, and it’s a nice round number. Averages are rounded to three decimal places. The batting-average tiers are separate and add to the total. The counts are small, so a change of one or two hitters moves the percentages a lot. The table is still useful, as I will get to.
All 22 hitters in the 30 or more HR group qualified. The 16 hitters in the 20-29 HR group who had fewer than 502 PAs in 2026 (and are not reflected in the table) are Ronald Acuna Jr., Byron Buxton, Oneil Cruz, Ty France, Zack Gelof, Nick Kurtz, Shea Langeliers, Francisco Lindor, Coby Mayo, Mickey Moniak, Joc Pederson, Jeremy Pena, Casey Schmitt, Corey Seager, Juan Soto, and Eugenio Suarez. Unfortunately, injuries hit several of these names (sigh) and are something we must deal with (calves, obliques, hamates, etc.).
30 or More HR Group
Power with a high batting average is hard to find. Only three of the 22 qualified hitters with 30 or more HRs hit .280 or better (look at the .280 or better row in the table; this trend is going the wrong way). The 2026 count was well under the six-year mean (57% below it). Admittedly, 2021 and 2024 inflate that baseline, but this group has thinned out noticeably over the last couple of seasons. The only members of this group in 2026 were Yordan Alvarez, Pete Crow-Armstrong, and Elly De La Cruz.
I had to list out a few unicorns here because this just doesn’t happen anymore. Over the six seasons from 2021 to 2026, only three qualified hitters reached 30 or more HRs with a .280 or better average in back-to-back seasons: Paul Goldschmidt (2021-2022), Aaron Judge (2021-2022 and 2024-2025), and Shohei Ohtani (2023-2025). For the stat geeks who are about to ask: Yordan Alvarez almost did it, but only had 496 PAs (6 short of qualifying in 2023). Oh, so close… maybe it happens in 2027.
The 30-HR group with a .240-.279 average declined 36% from last year and finished 10% below the six-year mean. Meanwhile, the under .240 group of 30-HR hitters was fairly flat by count. It was down 17% from last year, but that is one hitter, and it is 7% above its six-year mean.
20-29 HR Group
Switching to the 20-29 HR group, the .280+ portion stayed fairly flat, landing right in line with its six-year mean. Those hitters were Randy Arozarena, Drake Baldwin, Carson Benge, Jac Caglianone, Jackson Chourio, Yandy Diaz, Riley Greene, Michael Harris II, and Fernando Tatis Jr. There are not many to pick from here.
The .240-.279 portion of the 20-29 group was 12% below the six-year mean and 11% below last year, but there is no clear trend, as it bounced around from year to year. The significant change is at the bottom, in the under-.240 group, which we will cover in the next section.
20-29 HR Group: Under .240 BA

The 20-29 group made up 76% of all hitters with 20 or more HRs in 2026, up from 58% in 2021. The problem is that average is going in the wrong direction.
The primary driver? The count of qualified 20-29 HR hitters batting under .240 (below the league average) doubled from 2021 to 2026, and it is now 66% above the six-year mean. Over a third of all qualified 20-29 HR hitters (35%) bat under .240. Most of the power bats now come from a group that is more likely to hurt your average. This is where it gets tricky. Loading up on too many guys that fall into this group can sink your average like an anchor on a big cargo ship.
Conclusion
Taking a macro view of the last six seasons shows that league power held steady. However, the mix of hitters supplying it has shifted and the names have changed.
The 30-HR tier is shrinking and highly volatile. In a typical year, about four in ten of the previous year’s 30-HR hitters repeat. In 2026, it was closer to three in ten. Meanwhile, the 20-29 HR tier now makes up over three-quarters of all hitters with 20 or more HRs, and it comes at a cost. The number of qualified hitters in that tier batting under .240 doubled from 2021 to 2026, and they are now over a third of the tier’s qualified hitters.
Reliable power is hard to find, and last year’s 30-HR hitters are far from guaranteed to repeat. Guys who hit for both power and strong batting average don’t grow on trees, and the 20-29 group is where your batting average is most at risk.
The HRs will be there next year. Whether the same guys hit them, and what their BAs look like, is another story. That’s power. Next up, we’ll look at speed and see what trends show up on the bases. Thanks for reading. You can also find me on X at @Toolsy3.

Impact from increased Platoon splits. My guess is the avg HR/AB has steadily increased as the population of ‘HR hitters’ gets more concentrated. Which is what your data implies.
Thanks for the comment. I checked the league totals for the six seasons in my sample, and the HR rate per AB isn’t trending up. It was highest in 2021 and has bounced around. 2026 is lower than 2021. What has changed is the mix of hitters: fewer reach 30 HRs and more land in the 20-29 range. Platoon usage is a fair point, but it’s beyond what I had room for in this piece.