

As I mentioned in my last piece, this post will focus on stolen bases. I will take a top-down approach and then dig deeper into the category itself. As a reminder, it is a macro view of the category, not a draft guide or cheat sheet telling you who to draft or avoid.
I limited my historical data sample to 2023-2026, covering four years of stats. As you know, MLB implemented several rule changes that altered the stolen base landscape (larger bases, the pitch clock, and limits on pickoff throws). The changes reversed a league-wide decline in SBs. From my perspective, any comparison to stolen base totals prior to 2023 is irrelevant.
SB Totals

After peaking in 2024, stolen bases declined about 9%. They were down year over year and vs. the four-year average in 2026. Attempts have decreased every year since 2024. Runners are also getting thrown out a little more often as the success rate has trended down in each season. The decline isn’t massive, but efficiency has dropped steadily over the sample period.
SB Tiers
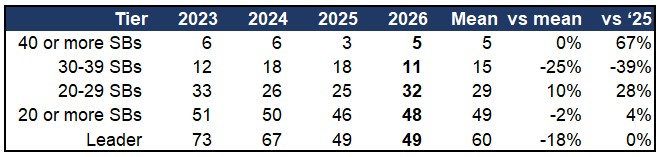
The table above shows how many hitters finished a season in each stolen base range. A hitter is only counted in one of the first three rows, while the 20 or more row combines those groups.
Even with steals down, the top tier, the 20-29 group, and the total with 20 or more SBs held steady over the sample, but the mix shifted. Fewer players fall into the 30-39 bucket.
Another dynamic is that the very top end has dropped off when compared to 2023 and 2024. Nobody has come close to Ronald Acuna Jr. (73) or Elly De La Cruz (67) over the last two seasons. In fact, no one has reached 50 SBs during the last two years. For context, three players reached 50 SBs in both 2023 and 2024. Perhaps we are due for one to show up next year.
SB Concentration
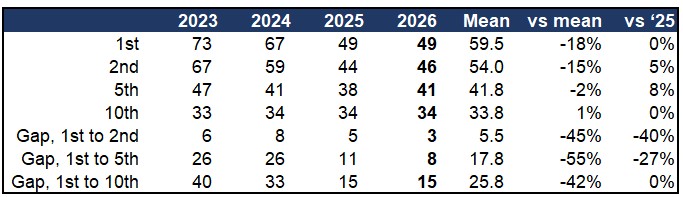
This table shows the top end of the stolen base distribution, including the SB leader total and the gaps behind the leader. As you can see, it is becoming more compressed at the top. Another way of looking at this is that the leaders are not pulling away from the pack as much as they did in 2023 and 2024.
What does that mean for fantasy purposes? It means you can find steals from a variety of sources and create a balanced team without needing a true elite option in the category. While it is great to have a player who does everything and gets a ton of steals, it isn’t a death blow if you don’t have one on your team. If the last two years are indicators of future results, we do not have to view players as major difference-makers in this category. Since everything is so bunched up at the top, there is less of a need to reach or pay a premium for steals.
SB Repeated vs New
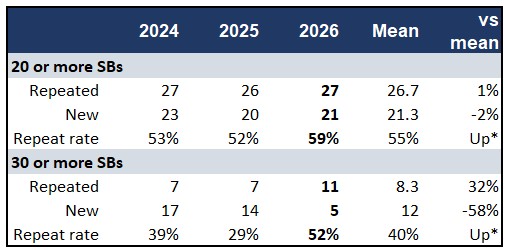
As in my HR piece, “repeated” means the player hit the threshold in consecutive seasons, while “new” means he got there after missing it the year before. The repeat rate is the number of repeaters divided by the prior-year group total. The groups overlap, so don’t add the totals together. You’ll also notice 2023 is excluded because the prior-year numbers are from before the rule changes.
The 20 or more SBs group turns over, but its overall size has remained stable. Unfortunately, the 30 or more group is more volatile and turns over more often. Interestingly, the 30 or more repeat rate was considerably higher in 2026 than in previous years. I can’t say this definitively from a small sample, but 2026 looks more like an anomaly.
30 SB Club
The repeaters were Chandler Simpson, Bobby Witt Jr., Jazz Chisholm Jr., Pete Crow-Armstrong, Fernando Tatis Jr., Jose Ramirez, CJ Abrams, Jose Caballero, Elly De La Cruz, Josh Naylor, and Oneil Cruz. No real shockers here except for Josh Naylor. Meanwhile, Jose Ramirez, now 34 years old, who doesn’t exactly look like a burner, is just that kind of dude who is going to run forever because that is how he plays.
I realize sprint speed does not necessarily mean everything when it comes to stealing bases, but let’s talk about Naylor again. His sprint speed, get ready for it, ranks 8th worst in baseball! He’s only ahead of a broken-down Giancarlo Stanton and catchers like Alejandro Kirk and Salvador Perez. Naylor is literally pulling a freight train out there. He somehow gets it done anyway.
The new additions were Nasim Nunez, Esteury Ruiz, Otto Lopez, Jake McCarthy, and David Hamilton. Several of these are part-timers, which is another benefit of this category.
30 SB Dropouts
Ten of the 21 hitters who reached 30 steals in 2025 did not do it again in 2026. Some of the dropouts are due to injury or reduced PAs (Soto, Lindor, Story, and Robert, though if you were expecting LuBob to steal 30, I have a set of leather-bound encyclopedias to sell you). A few are concerning to me, including Corbin Carroll and Trea Turner. I still believe in Carroll, but he needs to be more aggressive on the basepaths. He had a career-low 24 attempts in a full season (21 SBs). Yet he has elite sprint speed and led the league in triples for the 3rd straight year. He can fly. Perhaps his .239 BA had something to do with it, but he still logged 671 PAs.
Conversely, Turner will be 34 next year and attempted only 25 steals in 700 PAs. The speed is still there, but the willingness does not seem to be. Couple that with a career-worst OBP (.297) and declining power numbers, and I have concerns.
If Naylor can steal 30 with his sprint speed, what’s everyone else’s excuse? And I am serious about this. Yes, I am looking at Carroll, who should be able to steal 30 in his sleep if Naylor can do it. Then there’s Gunnar, who just continues to find more ways to disappoint (30 vs 10, what was that?!).
Power and Speed
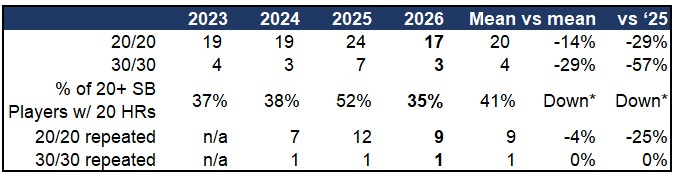
Now for everyone’s favorite: power and speed. Do not add the rows up since they overlap. A player listed as 30/30 is also included in the 20/20 group.
You will notice that I did not break out 40/40. While still rare, we have now had three 40/40 seasons over the last four years. Ronald Acuna Jr. (41/73) in 2023, Shohei Ohtani (54/59) in 2024, and Pete Crow-Armstrong (45/41) in 2026. Nobody got there in 2025. For the record, Alfonso Soriano was the last player to reach the 40/40 club prior to the rule changes, back in 2006.
It’s a small sample, but 2025 looks like the outlier here. The other three years are fairly close in terms of the counts for the respective clubs.
Since speed and power together are so coveted, I wanted to check what percentage of the 20 or more SB group also reached 20 HRs. The answer is a little more than a third, and it has been fairly consistent and slightly trending down if you view 2025 as an outlier as I am doing.
Power and Speed Repeats
Nine of the 24 hitters who went 20/20 in 2025 did it again in 2026 (38%), compared to 63% in 2025 and 37% in 2024. The nine were Pete Crow-Armstrong, Elly De La Cruz, Fernando Tatis Jr., Jackson Chourio, Zach Neto, Randy Arozarena, Corbin Carroll, Julio Rodriguez, and Oneil Cruz. Only three of them (Carroll, Rodriguez, and Arozarena) went 20/20 in all four seasons.
Of the 15 who fell out, five missed on HRs, five on SBs, and five on both. Narrow HR misses include Jazz Chisholm Jr. (19/41, pretty close to that 50/50 goal too!) and Bobby Witt Jr. (18/45). I love Witt, but that HR total was light. Okay, it was terrible if I am being honest. Seriously, they moved the fences in and he hits the ball hard. I think it’s more likely he hits 30 HRs than under 20 again, but that’s only my opinion. I’m willing to go down with the ship on that one.
According to this sample, the 30/30 player rarely repeats. Exactly one hitter repeated in each of the three years: Witt in 2024, Ramirez in 2025, and PCA in 2026. So that means only 3 of 14 (21%) repeated, and in 2026 it was 1 out of 7 (14%).
Speed and Average

While power and speed are sexier, batting average is another dimension tied to SBs, and the data shows a shift worth noting. The 20 SB group has been stable in size, with 31 to 37 qualified hitters each season, but the BA mix of that group changed in 2026. As a reminder, this data only includes qualified hitters, which means 502 or more PAs. Not every 20-steal hitter qualified (13 of 48 hitters, or 27%, had fewer than 502 PAs). Hitters who finished .280 or better reached a four-season high of 12, roughly a third of the group. The hitters under .240 also reached a four-season high of eight, though that group has bounced around each year.
The biggest change was in the middle. The .240-.279 group, which had been about 60% of the group in the other three seasons, fell to 43%, losing eight hitters from 2025. More hitters finished under .240, which is similar to what I found in my HR article, where more hitters in the 20-29 HR groups also hit under .240.
Conclusion
The takeaways here are pretty straightforward. The stolen base environment has shifted, but not in the way many expected after the initial rule tweaks. Steals are down, but the number of players reaching 20 steals is about the same. The top end is flattening out, overall efficiency is slowly dipping, and the leaders are no longer pulling away from the pack. The distribution is compressed, and steals are widely available. Some players are better than others, but no single player creates a meaningful category advantage.
When you look across the four-year sample, 2025 stands out as the statistical outlier for power-speed combos. The other three seasons show more stability and a declining trend. Beyond the drop in raw totals, the batting average mix of the 20 SB group stands out. The middle group of .240 to .279 hitters shrank in 2026, while more hitters finished under .240. As much as I don’t like it, this sample shows that expecting a 30/30 season, or a repeat of one, is a tall ask. That’s not going to stop us from chasing it, but it is more of a reminder to level-set your expectations. Thanks for reading. You can find me on X at @Toolsy3.
