
With all the changes to the 2020 season to the 2020 seasons swirling around, I wanted to narrow in on one specific item: the DH in the NL, and specifically, the impact to pitchers. I’m comparing Rudy’s Steamer/Razzball projections from March to those here in July; we’ll focus in on changes in projected ERA.
At first glance, it’s easy to minimize this change. After all, we’re talking about 2-3 plate appearances per start, and pitchers aren’t complete zeros at the plate. In a reduced season, this is likely only 25-35 plate appearances over 10-12 starts. How big of a deal is it?
To set a baseline, let’s first look at the impact on AL starters. Here’s the top 50, comparing their March to July ERAs:
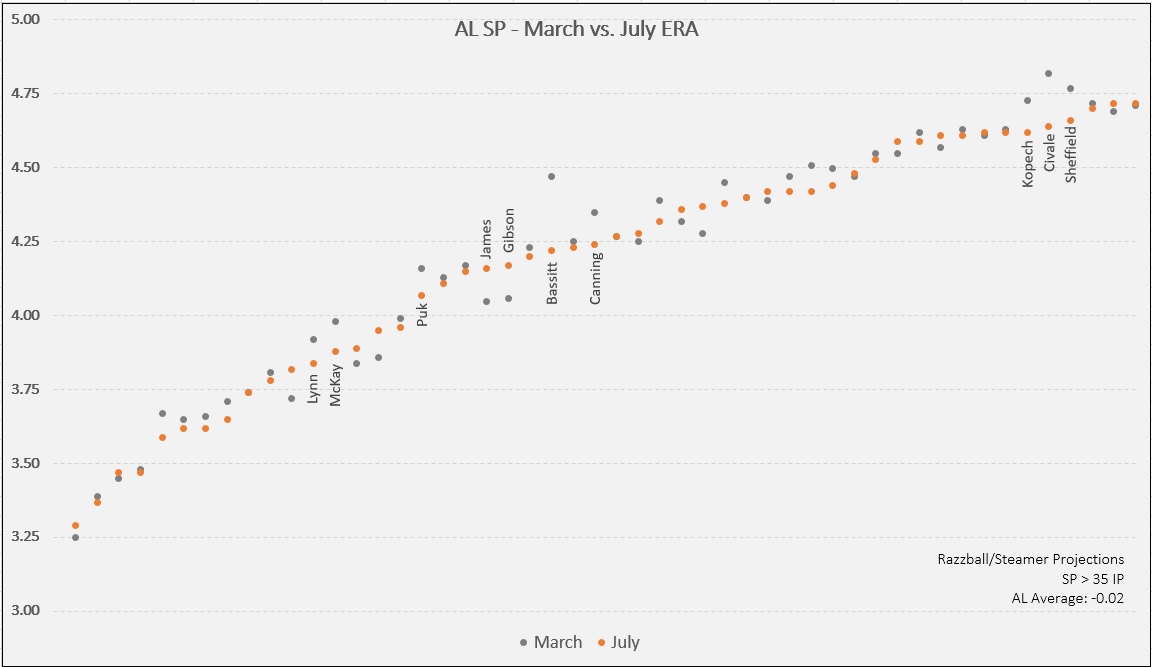
All things considered, there’s relatively little movement. On average, ERA went down by 0.02 across the pool. I’ve labeled a few of the biggest movers; guys like Lance Lynn, Brendan McKay, A.J. Puk, Chris Bassitt, and Griffin Canning have seen ERAs drop by at least a 10th of a run. Meanwhile, Josh James and Kyle Gibson are seeing the biggest spikes, but even that’s just 0.11 runs. Late fliers with improved outlooks include Michael Kopech, Aaron Civale, and Justus Sheffield. Maybe you can see a pattern here, but mostly, this is the type of small movement we can expect to see as projections are updated to reflect individual players/teams, and not reflective of any league-wide impacts.
Let’s flip over to the NL starters. Will we see a similar pattern?
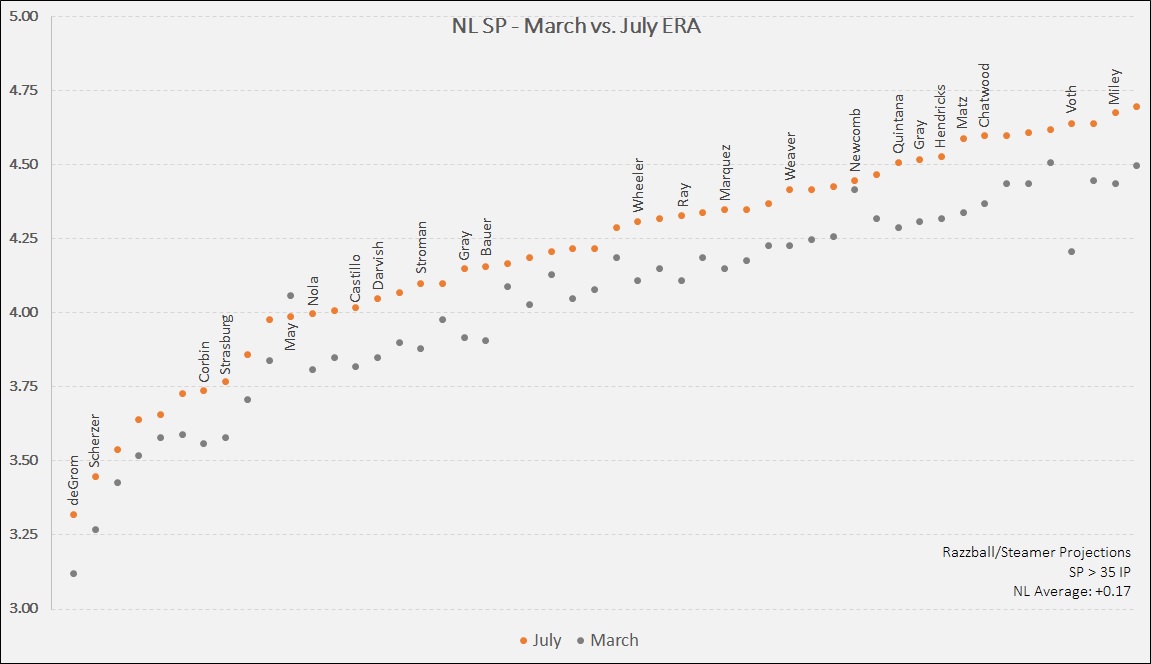
This graph looks completely different than the AL version. On average, NL starters ERA bumped up by 0.17 runs. There are 67 SP in the NL who’s ERA increased by at least 0.11, which was the highest in the entire AL pool. In fact, as we look across the pool of NL SP projected for at least 35 IP, only one has a projected ERA lower in July than in March: Dustin May. Combined with a possible increased workload due to David Price bowing out, Dustin looks appealing at current cost (current NFBC ADP: 253).
I’ve labeled all the SP with ERA increases above the average, and there are quite a few names. We’re now down to only 11 pitchers projected below 4.00 (compared to 19 in March, and 16 in the AL today). Generally speaking, NL West pitchers fare a little better than those in the East and Central – you can review last week’s post for a hint as to why. It’s barely worth calling out specific names, as this impacts the top end (Jacob deGrom, Max Scherzer) all the way through to late fliers like Steven Matz, Austin Voth, and Wade Miley.
Let’s review one more graph: how has this impacted Relievers?
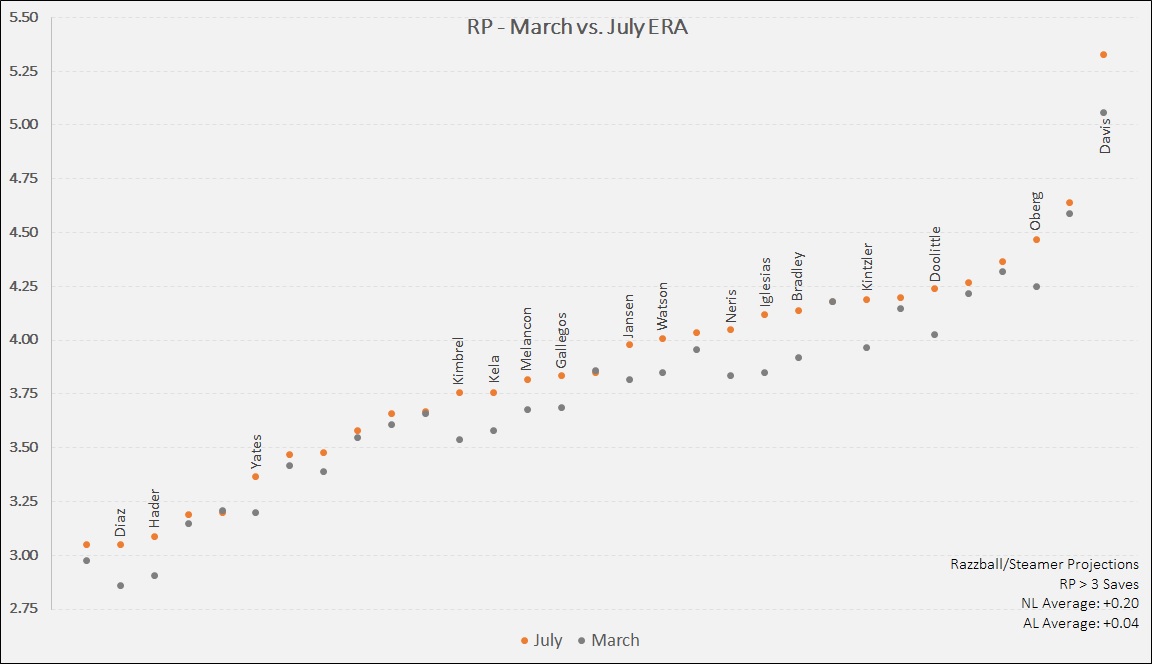
The same story plays out here. Among RPs with 3+ projected saves, the NL average ERA went up by 0.20 runs, while the AL increase was just 0.04. Every pitcher labeled due to a big movement hails from the NL.
Summary
Due to this rule change, there’s a 0.20-0.25 ERA change between NL & AL pitchers compared to March. If you’re not building the NL DH into your draft plans, or God forbid, if you’re drafting using ranks or a spreadsheet from March, you’re at a decided disadvantage.
If you’re not a projections drafter, you still need to build this impact into your qualitative assessments. Ignore at your own peril.