
When assessing starting pitchers, savvy fantasy players look at a wide variety of measures. Velocity, stuff, BABIP, Statcast, 2019 performance…balancing out all of the available metrics to determine cost (draft slot, $ value) is the name of the game.
Today we’re going to look at a metric I rarely see discussed in the pre-season: strength of schedule (SoS). In-season, SP matchups are gold, whether you’re playing DFS or streaming in season-long. But before the year, I rarely see analysis go any deeper than AL-vs.-NL comparisons. This makes partial sense because we don’t know what a rotation will look like beyond the next week, making projecting out specific matchups impossible.
At the team level, however, we can get get a pretty good handle on who may have advantageous matchups and who will have a tough road in front of them. More specifically, we’re interested in the extremes: How frequently will each team face really tough matchups, or really easy ones? These are actionable (start/sit decisions). For the rest – the fat part of the bell curve – we’ll mostly be making decisions based on individual SP talent, not matchup.
One other note: in a 60-game season, each SP only gets 10-12 starts, meaning SoS will be more important than normal. In a reduced season, there isn’t time for the schedule to balance out. If a Rays pitcher has to face the Yankees three times, that’s 25-30% of their 2020 season stats, and you may want to downgrade them on draft day.
I’m basing this analysis on the proposed breakdown of the 60-game schedule found on MLB.com:
- 40 games against division opponents (10 against each team)
- 20 interleague games against the “geographic counterpart in the other league” (i.e. NL East vs. AL East). For the purposes of this analysis, I’m assuming 4 games against each of the 5 times.
Methodology:
- Take projected runs-scored per team (Fangraphs)
- Adjust based on historical home/road splits for each team (e.g. over the last 5 years, the Rockies averaged 5.90 R/G at home vs. 4.03 on the road)
- Assume an even split of home/road games with each opponent (schedule may not play out this way, but for analysis that’s the assumption)
- Split out matchups to bottom 25% (target), top 25% (avoid), and the middle 50% (no action)
Finally, we come to our chart of the day, looking at the breakdown of teams’ schedules:
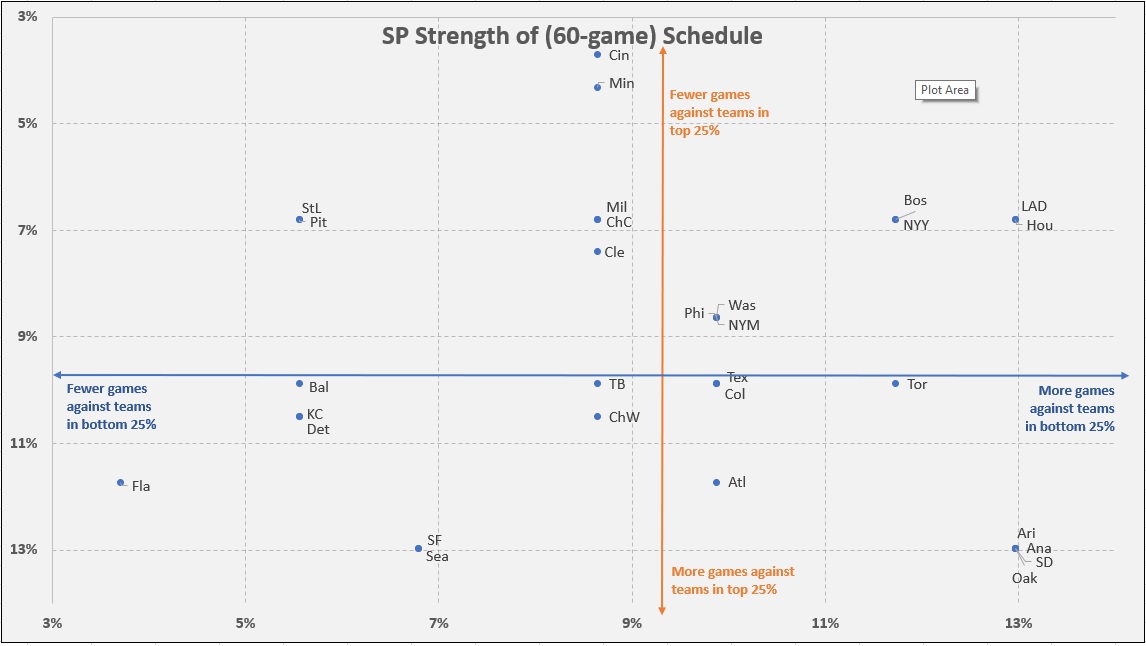
Bottom Left: Avoid
This quadrant has fewer games against the bottom 25% (streamable starts) and more games against the top 25% (avoid). Take the Marlins, for example: nearly 12% of their games are projected as top-25% matchups, while less than 4% are against the bottom of the league. None of their intra-division games are matchups to target, and only the Orioles would be streamable interleague. Meanwhile, games on the road at Atlanta, Washington, Philadelphia, Yankees, and Boston, all fall in the top-25% hardest matchups across the league. Nobody’s beating down the door to draft Marlins SP, but maybe wait an extra two rounds before taking late fliers on Sandy Alcantara, Caleb Smith, Johnny Cueto, and Jeff Samardzija.
Top Left: Mixed
This quadrant provides fewer streamable starts (bottom 25%), but also fewer danger matchups (top 25%). St. Louis serves as a good example: just less than 7% of their games are against the upper echelon, well below league average of 9.25%. But, less than 6% of their starts fall in the streamable category. For the most part, their matchups are in the middle, where you’re mostly playing the quality of the starter.
Bottom Right: Roller Coaster
Whereas the last quadrant showed teams with middling schedules, this one is full of risk & reward. Take Arizona: a full 13% of their games are against the top of the league, where you’ll want to sit all but the best arms. But another 13% are facing the bottom 25% of the league – plenty of streamable starts. Compared to the last quadrant, I’d rather have some matchups to target and avoid the rough spots, than a bunch of games against the middle part of the league. This means that SoS favors Dinelson Lamet and Frankie Montas over Joe Musgrove and Dakota Hudson.
Top Right: Targets
These teams have the best of both worlds: plenty of streamable starts, fewer danger spots. The Dodgers & Astros stand out. Both have 13% of their games against the bottom tier, but less than 7% against the top of the league. I don’t need to tell you to draft Walker Buehler or Justin Verlander, but maybe this moves you towards Jose Urquidy or Alex Wood?
Summary
There aren’t enormous differences pre-season, and specific pitchers will end the season with wildly different SoS-faced numbers. There’s something here; SP quality aside, I’d rather roster guys who have increased odds of facing the bottom of the league. All things considered, this should be a tie-breaker, not a decision-maker on draft day.