

This is the third installment of my macro series and the first of two parts covering starting pitching. As a reminder, this is a macro view of the category, not a draft guide or a cheat sheet telling you who to draft or avoid. Most fantasy managers already know workloads are shrinking and wins are getting even harder to project. The goal here isn’t to uncover anything new, but to quantify how those trends have evolved over the last six seasons and examine where the changes are occurring.
My data sample covers six years of stats, from 2021 to 2026. Three important changes happened during this period: a league-wide crackdown on the “sticky stuff” in mid-2021, the implementation of the pitch clock in 2023, and the ABS challenge system in 2026.
High-Level Ratio Stats
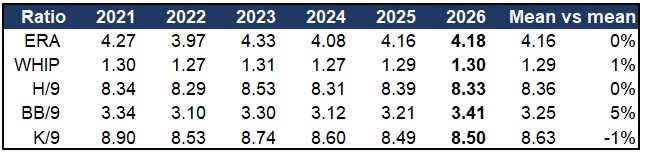
First, let’s take a look at some key ratios. The majority of the ratios have held up over the last six years with the exception of walks and strikeouts. Walks reached a six-year high in 2026. Strikeouts were flat compared to 2025, but have actually come down slightly since 2021. This decline is beyond the scope of this piece and would probably require a separate deep dive.
Wins
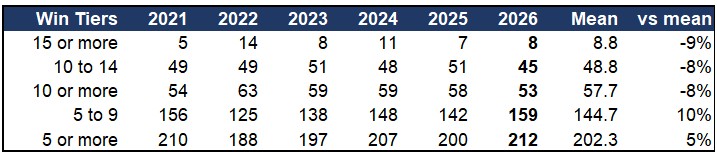
The table includes both starters and relievers.
The number of pitchers with 10 or more wins fell to 53 in 2026, and that’s the lowest of the six seasons. It’s 9% below 2025 and 8% below the six-year mean. The 10-to-14-win group also hit a six-year low.
The 15-or-more-win group is small and volatile (5 to 14 over the six seasons), but 2026 was just under the six-year mean. The group turned over completely: none of the seven pitchers who reached 15 wins in 2025 did it again in 2026. The eight 15-game winners in 2026 were Cristopher Sanchez, Sonny Gray, Eduardo Rodriguez, Jacob Misiorowski, Drew Rasmussen, Nick Martinez, Foster Griffin, and Chase Burns.
The largest move is in the 5 to 9 win group, which reached 159 pitchers (the most of the six seasons). This group grew 12% compared to 2025 (17 more pitchers). The 5-or-more-win group also reached its highest level in six seasons and included 212 pitchers.
15-Win Standouts
A few names stand out to me here. Let’s start off with a couple of head-scratchers (over-performers). To his credit, Martinez was great this year, but he had a 3.10 ERA vs. a 4.63 SIERA and a 3.97 xERA. Regression fairies, what say you? E-Rod is the other who had a fantastic season, but he had a 2.89 ERA vs. a 4.62 SIERA and a 4.27 xERA. Call me a skeptic, but good luck expecting those two guys to do it again.
I also want to touch on Sonny Gray, who tied Cristopher Sanchez for the league lead with 18 wins. Gray had a wonderful 2.72 ERA, but he was the lucky one on his team. Payton Tolle, who had a 3.03 ERA, only had nine wins. Ranger Suarez had a solid 3.22 ERA but only eight wins. The one thing Gray did have over these guys was more innings pitched, which is a big driver of pitching counting stats. However, he only pitched about 20 more innings and got twice as many wins. Seems kind of wonky, doesn’t it?
10-Win Repeats

Repeated means the pitcher hit the threshold in consecutive seasons, while new means he got there after missing it the year before. Repeat rate is the repeated total divided by the prior-year group total. You’ll also notice 2021 is excluded because 2020 was a shortened season and gives us no baseline.
As I would expect, wins really don’t carry over all that well. We cannot eliminate the luck factor. There are so many variables beyond a pitcher’s control that go into getting a win. And please don’t get me started on the rules and how a pitcher qualifies for or is credited with one.
In 2026, more than six out of ten pitchers (64%) who reached 10 wins in 2025 failed to repeat, slightly above the five-year average of 59% (173 of 293). Of the 58 pitchers in the group, 37 dropped out. Four did not pitch in 2026 (Ryan Pepiot, Quinn Priester, Edwin Uceta, and Clayton Kershaw), and of the 33 who did, 24 threw fewer than 150 innings.
Innings Pitched
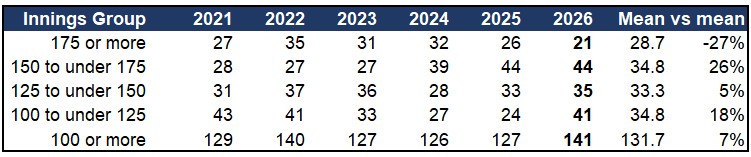
With ERA and WHIP flat and strikeouts down slightly, innings pitched is probably the better lens to view how starting pitching is changing. Sure, it’s not everything, but in theory, more volume helps with counting stats. Ratios are more complicated.
I settled on 25-inning increments and a ceiling of 175 IP or more. I initially considered using 180 innings as the top tier, but only 13 pitchers reached that level in 2026. Just three reached 200 innings, matching the six-year low: Sandy Alcantara (214.0 IP), Cristopher Sanchez (207.0), and Michael Wacha (200.2). Shoutout to Sandy. He is a true throwback guy and built differently.
The other 10 pitchers who reached 180 innings were Cam Schlittler (193.2), Eduardo Rodriguez (189.2), Tanner Bibee (188.0), Parker Messick (186.1), Logan Gilbert (186.0), Reid Detmers, Yoshinobu Yamamoto, and Michael King (185.0 each), Gavin Williams (184.1), and Nick Martinez (180.0). Another eight starters finished between 175.0 and 179.2 innings, which is why I ultimately lowered the threshold to 175 innings for this analysis. In many ways, that 175 mark has become the new 200.
Shrinking Workloads
Even with the bar lowered to 175 IP, the top tier count fell to 21 pitchers in 2026, the lowest of the six seasons. That’s 19% below 2025 and 27% below the six-year mean of 28.7. While the group bounces around year-to-year, the trend is clear: workloads are shrinking at the top and the true workhorses are disappearing.
The largest group of starters now finishes between 150 and under 175 innings (44 pitchers, tying its six-year high). The 100-to-under-125 group went from 24 in 2025 to 41 and is above the mean.
The count of pitchers with at least 100 innings hit 141, the highest of the six seasons. I left the cutoff at 100 IP since anything lower than that would involve more relief pitching, and I wanted to focus more on starters.
Repeat vs New (Higher Innings Pitched)
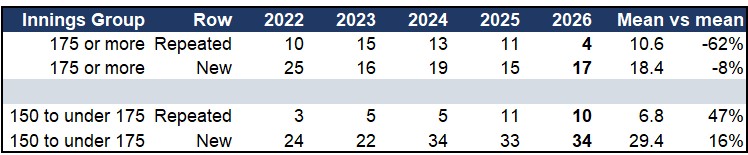
Knowing how many pitchers reach the innings tiers is only part of the story. The bigger question is whether the workload sticks around.
Fewer pitchers are hitting 175 innings two years in a row, and the number repeating has fallen every year since 2023. Only 4 of the 26 who got there in 2025 did it again in 2026 (15%): Cristopher Sanchez, Kevin Gausman, Tanner Bibee, and Jesus Luzardo. That is the lowest rate over the five-year sample, which ranged from 15% to 43%. The repeat rate over the sample was 35%, or 53 of 151 pitchers.
The 150-to-under-175-IP group has high turnover too. Of the 44 pitchers who hit the 150-to-under-175-inning level in 2025, 10 (23%) repeated in 2026. In the 2026 group, 34 pitchers (77%) were new to it, meaning they were not in it in 2025.
The 23% repeat rate is understated in the 150 to under 175 IP group. Not repeating in this group does not always mean a step backward. When you factor in the eight pitchers who jumped to 175 or more innings in 2026 (Yoshinobu Yamamoto, Shane Baz, Gavin Williams, Jose Soriano, Eduardo Rodriguez, Sandy Alcantara, Michael Wacha, and Nick Martinez), the repeat rate improves to 18 of the 44 pitchers in the 2025 group, or 41%. Of the rest, 22 fell short of 150 innings and four did not pitch in 2026: Ryan Pepiot, Jose Berrios, Quinn Priester, and Kyle Hendricks.
Adjusting the 175-or-More Group
No adjustment for pitchers moving up is needed for the 175-or-more group, since it is the highest tier in how the data was grouped.
Not repeating does not always mean a big drop here either. A pitcher who threw 174 innings counts as not repeating. Of the 26 pitchers who threw 175 or more innings in 2025, 13 (50%) still threw at least 150 innings in 2026: four repeated at 175 or more, and nine threw between 150 and under 175. The other 13 fell below 150 innings.
Average Wins Per IP Group
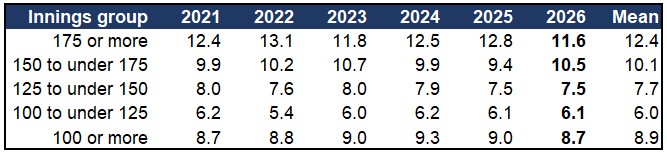
Innings and wins move together. Over the six seasons, pitchers in the 175 or more IP group averaged 12.4 wins, compared to 6.0 for the 100 to under 125 IP group. Those averages stayed within a narrow range year to year, though the 175-or-more group dropped to its six-year low of 11.6 in 2026.
Conclusion
Elite volume is disappearing. The traditional 200-inning workhorse starter is nearly extinct. The threshold for the top group now sits at just 175 innings, and even that group hit a six-year low in 2026.
Double-digit win totals hit six-year lows. More pitchers are landing in lower win groups.
Year-to-year stability is low. Prior-year performance does not translate well into predicting future innings or wins. Repeat rates for both 175-inning seasons and double-digit wins remain low. Roughly six in ten pitchers who reached either 10 wins or 175 innings did not reach the same threshold the previous season. Even if anyone who stayed at 150 or more innings counts as a repeat, at least half of the pitchers in the top two innings groups still fell below 150 innings in 2026.
In the next macro piece, I will continue with starting pitching and look at it from a few more angles. Thanks for reading. You can find me on X at @Toolsy3.
