

Every broadcast has the moment. A hitter lays off a slider at his ankles, spits on a fastball a few inches off the plate, and then crushes the one pitch that drifted into his happy place, and the analyst says he “got his pitch.” We all nod, because we know what that means, even though nobody has ever shown us where that pitch actually lives. Statcast now tells us where the ball met the bat, not just where it crossed the plate: how far off the hitter’s body, how far out in front of him, and how high. Stack every ball a hitter puts in play into that space, and you can finally draw his happy place.

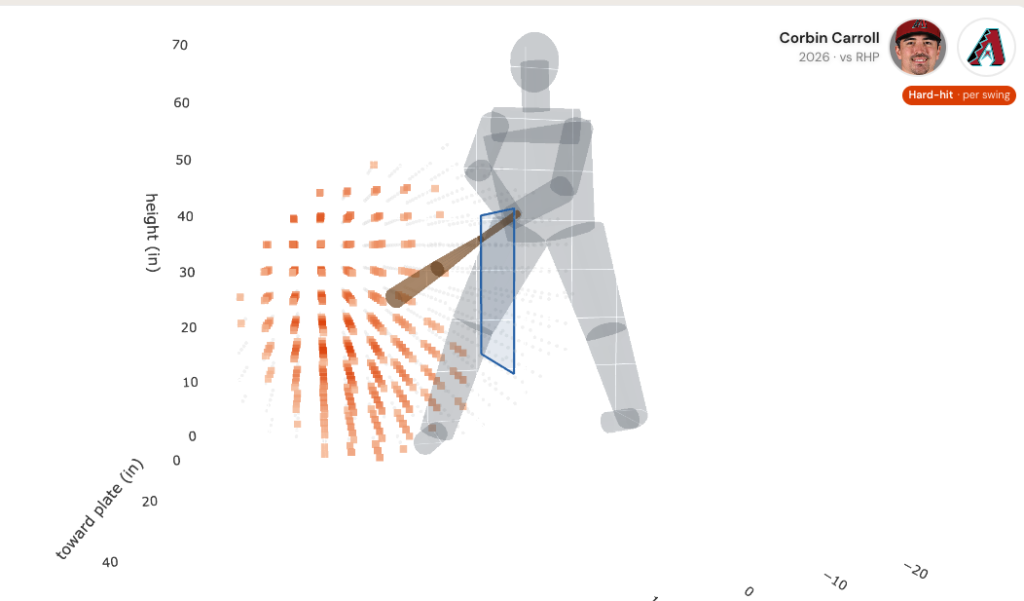
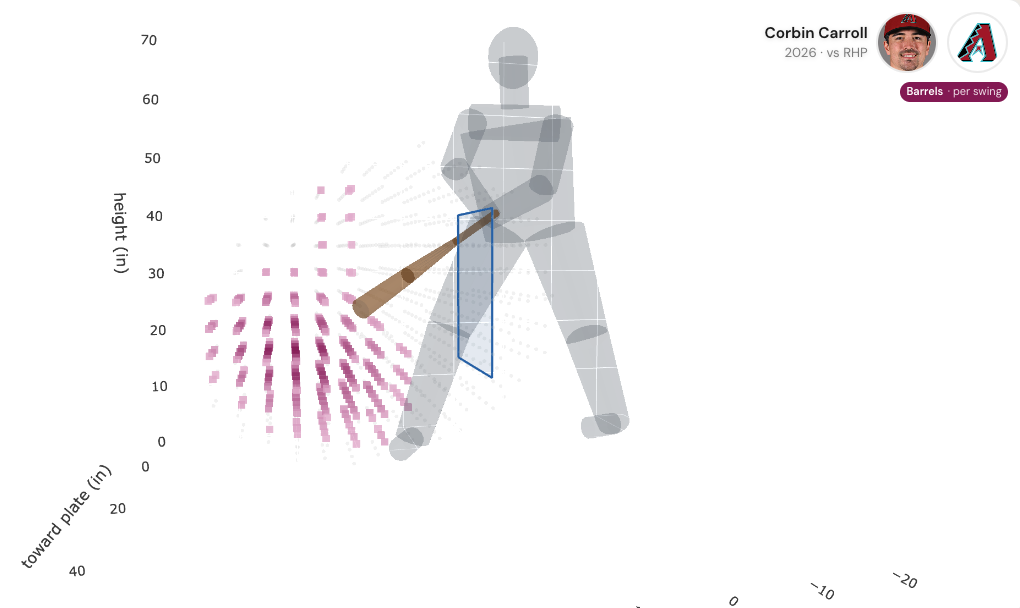
To help visualize the happy place (sans Julie Bowen and tricycle cowboy, unfortunately) I created the 3D Swing Explorer. It chops every space around a hitter and his bat path into 3-inch cubes and lights up the cubes where his contact turns into damage. I’m calling that his Hard-Hit Possibility Space (HHPS): the cubes where at least half of his balls in play leave the bat at 95+ mph (Statcast’s definition of a hard-hit ball). Flip a toggle, and you get his Barrel Pocket instead, the cubes where at least 15% of his balls in play are barrels (Statcast’s label for the exit velocity and launch angle combinations that do the most damage). You can split it by pitcher hand, switch from “per contact” to “per swing” so whiffs count against the hitter, and drop the ABS strike zone in for reference. The number of lit cubes is the size of his space.
Spin a few hitters around and three things jump out.
#1: Out Front, or Let It Travel
The first thing you notice is that the orange hard-hit space and the purple barrel pocket are not in the same place. A hitter’s hard-hit space sits right where he usually meets the ball; on average, it is centered almost exactly at his normal contact depth. His barrel pocket sits about five inches further out in front. That is true for 83% of qualified hitters, and it makes sense once you picture it: hitting a ball hard mostly takes getting the barrel on it with some speed, which you can do across a range of timing, but a barrel also needs lift and a pull-side bat angle, and those come from catching the ball before the bat has finished working through the zone.
Corbin Carroll is the extreme version. His barrel pocket against right-handed pitching is parked about 38 inches in front of his body, 15th deepest among the 119 hitters with at least 20 barrels off righties this year (that group averages 34 inches). But look at the rest of his map, and you’ll see he makes all of his contact against righties out front (36 inches, compared with about 31 for that same group), so his barrel pocket is barely ahead of his normal contact point. Pete Crow-Armstrong, Elly De La Cruz and Carter Jensen look the same. For most hitters the barrel pocket is a place they have to reach; for Carroll it is where he already lives.
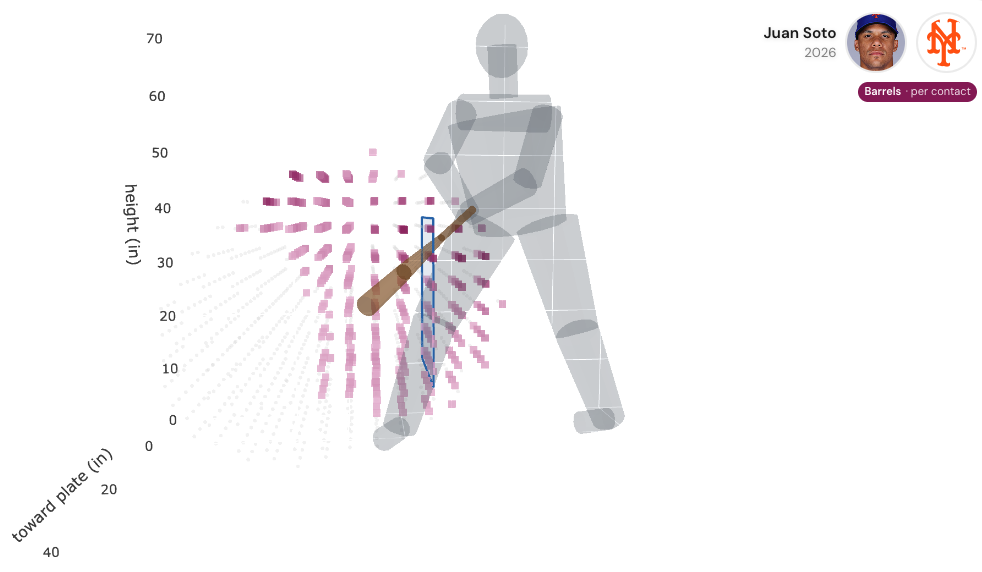
Now drop the ABS zone in and look at the other end of the map, the cubes that sit behind the zone, closer to the catcher than the middle of the plate. This is where contact goes to die. Only about 7% of the league’s balls in play are hit that deep, and they are hard-hit 33% of the time (against 38% overall) and barreled less than 1% of the time (against almost 8% overall). Most hitters have little, or nothing, lit back there. A few of the best power hitters in baseball have a whole shelf of it. Shohei Ohtani meets 18% of his contact that deep and still hits half of it 95+ (32 of 65 balls, including six barrels). Pete Alonso hits 61% of his deep contact hard (22 of 36). Juan Soto and Spencer Jones light up the back of the map too. These are the hitters who can let the ball travel and still punish it.
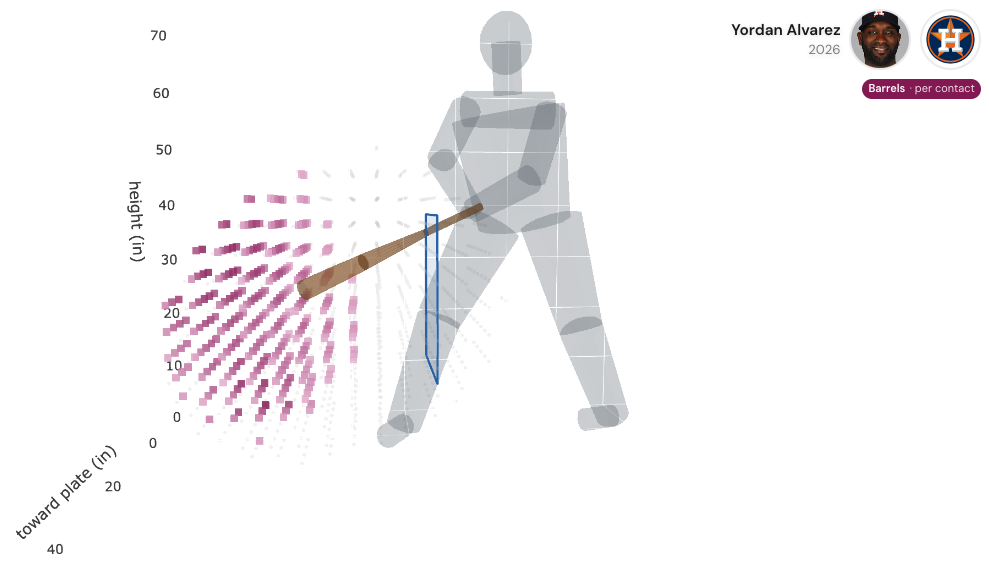
Yordan Alvarez is the fun contrast, because he is every bit as dangerous and has almost nothing back there. It isn’t that he can’t do damage deep; it’s that he never gets deep. Only four of his 425 balls in play all season were hit that far back, and his average contact point is about ten inches further out front than Ohtani’s. Same destination, opposite routes: Ohtani and Alonso can wait on a pitch, and Yordan (like Carroll and Junior Caminero) goes and gets it.
#2: Same-Side Shrinkage
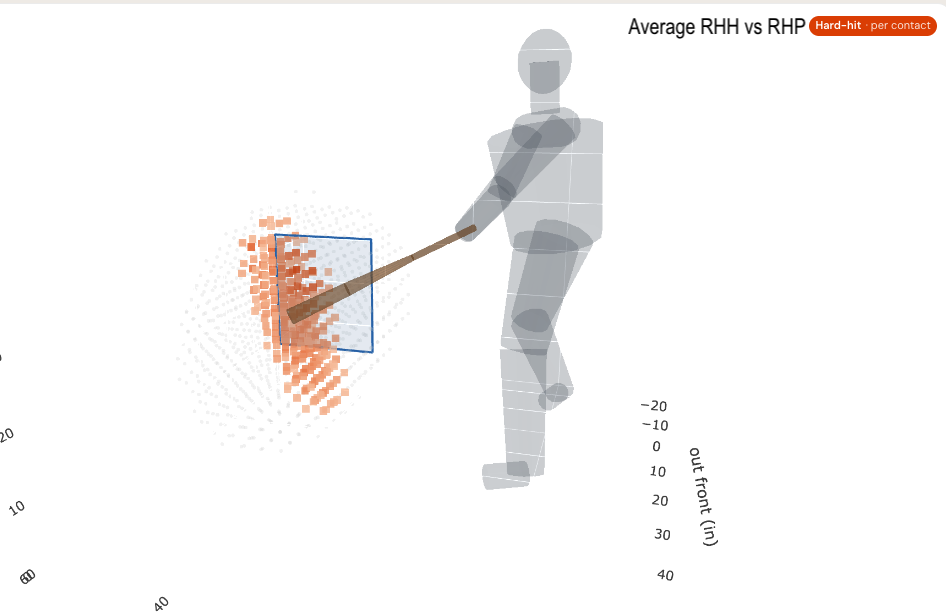
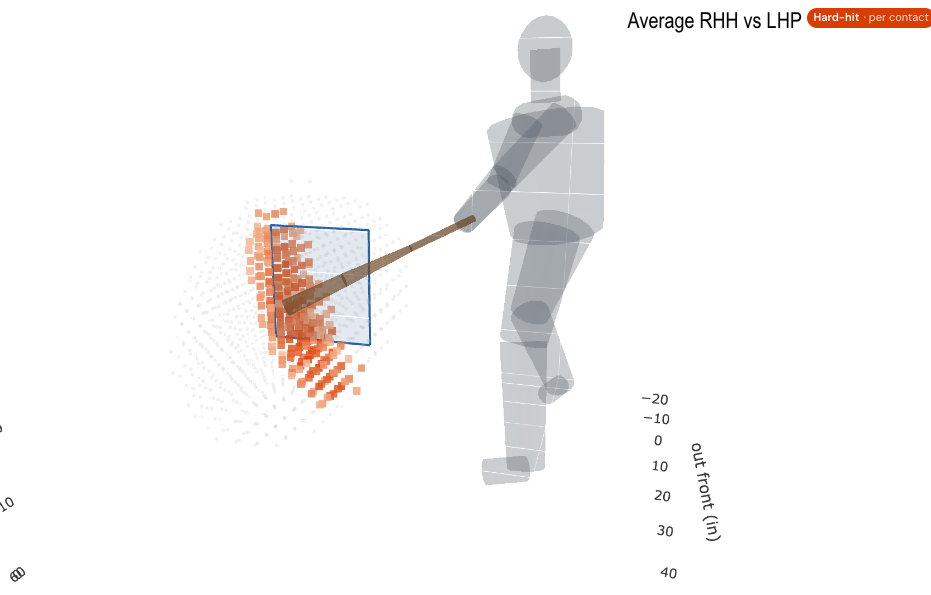
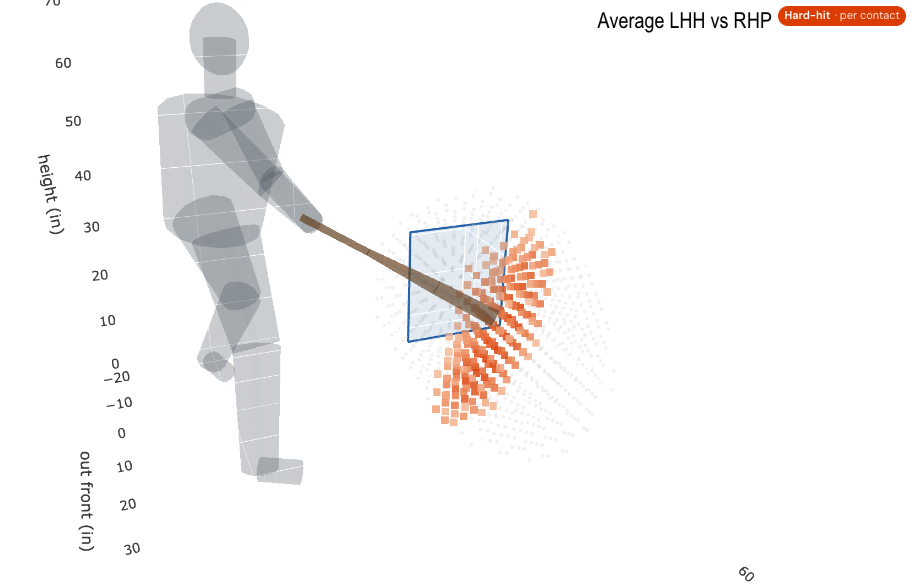
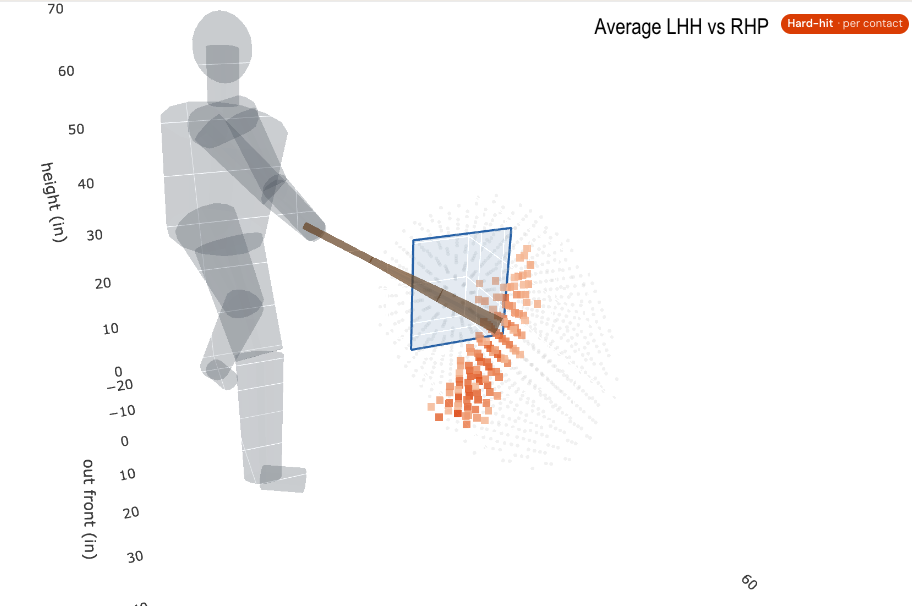
Everybody knows lefty-on-lefty is a tough matchup. The explorer lets you see how tough. Here is the league-average hard-hit space for each batter and pitcher handedness combo this season:
Right-handed hitters against righties light up 241 cubes, and against lefties 248. Left-handed hitters against righties light up 226. Left-handed hitters against lefties light up 123. The barrel pocket follows the same pattern (41 cubes for lefty-on-lefty, 74 to 102 for everything else). The hard-hit rate difference behind it looks modest on a leaderboard (34.6% for lefty-on-lefty against 37.6% to 39.8% for the other three matchups), but in space it is dramatic: a left-handed hitter facing a lefty loses roughly half the places where he can hit the ball hard. It is the platoon split, drawn in 3D.
#3: Homers Are Thrown, Not Hit
There’s an adage saying that home runs are thrown, not hit. The explorer gives us a way to test the flip side of it: if a hitter’s damage lives in a specific pocket, does it pay to wait for the pitch that is headed there?
To measure it, I projected each hitter’s hard-hit space onto the plate, like a strike zone view of his happy place, and checked how often he swings at pitches that cross it compared with how often a typical hitter swings at a pitch in that same location and count. Call it hunting. Almost everyone hunts a little: the average hitter swings about eight percentage points more often than expected at pitches crossing his space. Some hunt much harder than others, and it’s a real trait that carries over from 2025 to 2026 about as well as most plate discipline stats do.
The hunters get paid. Building each hitter’s space from one half of a season and measuring his swings and results in the other half, across 2025 and 2026, the hitters who hunt harder post better hard-hit rates, barrel rates and xwOBA (expected weighted on-base average, Statcast’s estimate of production based on how the ball was hit).
Here’s the part that stuck with me. You would think the hitters who most need a mistake pitch, the ones who don’t barrel many balls and so don’t have much space, would be the ones who hunt hardest. It’s the opposite. Only about a third of low-barrel-rate hitters are hunters, compared with about two-thirds of high-barrel-rate hitters. The ones who do hunt make it work: low-barrel hunters average a 37.2% hard-hit rate and a .315 xwOBA, against 34.1% and .304 for low-barrel non-hunters.
Freddie Freeman is the example of how this should work. His barrel rate this year is an ordinary 7.6% (34 barrels), right around league average, and his barrel pocket is a modest 124 cubes. But when a pitch is headed there, he goes after it: about seven points more often than expected this year and 13 last year, which put him in the top quarter of hitters in 2025. He’s sitting on a .363 xwOBA. Jose Altuve barrels 4.3% of his balls in play (16 barrels), and his barrel pocket is a fifth the size of Freeman’s (25 cubes). And he swings less often than expected at pitches crossing it, about six points under this year, which ranks among the lowest in baseball. He was near the bottom last year too. His xwOBA is .269. When you don’t have a lot of places to do damage, you’d better be waiting for the pitch that goes there.
Two things this doesn’t show, so you don’t over-read it. First, hunting doesn’t predict a breakout: a hitter’s 2025 hunting told us nothing about his 2026 barrel rate. Second, having a small space doesn’t make a hitter more likely to hunt. Hunting looks more like part of who a hitter is than a switch he flips.
Go Play With It
The 3D Swing Explorer has every hitter from 2024 through 2026, updated through the end of the regular season. A few things to try: pull up Carroll against righties and hit the barrel toggle; put Ohtani and Yordan side by side and look behind the zone; compare any left-handed hitter against righties and lefties; find your favorite contact hitter and switch between per contact and per swing to see how much of his space survives the whiffs. A couple of notes before you dive in: the see-through hitter is a generic figure for scale, not the player’s actual body; the strike zone’s height and side-to-side placement are measured for each hitter, but its distance out front is an estimate; and small samples (fewer than about 50 balls in play) intentionally show few cubes, which means “not enough data,” not “no skill.”
And That’s A Wrap! 🎬
This is the last Stat Chat of 2026, since the column clocks out when the regular season does. Thank you for reading, arguing, and sending me the weird stuff you found. Here is everything from Season 2 in one place, in case you missed any or want to relive the chaos:
- Panning For Spring Gold (Feb 28)
- The Vibe Zone And The Vibe Based Swing Decisions (Mar 14)
- The Groundhog Season And The Stability Coefficient (Mar 27)
- Scatman Plotters And The New Scatter Plot Tool (Apr 11)
- Fog Of WAR And Understanding WAR Components (Apr 24)
- Beyond The Bat Tracking-Verse: The Rocking Chair And The Mishits (May 9)
- 2-Strike Bat Speed And The Swing Away Merrills (May 23)
- Count Leverage And The K-BB% Mystery (Jun 6)
- Pitcher Energizer Or Rayowhack? Is There Anything To Buy From Battery Splits? (Jun 20)
- Hole Lotta Love. Is There A Hole In Your Swing? (Jul 4)
- Fool Points And The Search For A Kung-Fool Master (Jul 18)
- Umpconscious Bias 2: Do Umpires Strike Back? (Aug 1)
- Platoon Entropy And The Chaos Theory Eating Kirby (Aug 15)
- Cristopher Sánchez And The Linchpin Tax (Aug 29)
- Blame Split And The One-Run Whodunit (Sep 12)
The tools from this season (the scatter plot tool, Battery Splits, the WAR breakdown, and now the 3D Swing Explorer) all live under one roof at Baseball Hopper, and they keep updating through the offseason. Go poke at them, and I’ll see you in the spring for Season 3.
