
As of this writing, Part 3 of The Eighteenth Out literally went out to the public less than an hour ago and I’m already back in the lab, ready to see where our latest exciting correlative discovery may take us. Nothing like a good statistical breakthrough to start the week, am I right? If you’re just joining me on my exploration through time and sports you can catch up on the foundations for this work here (Part 1, Part 2, Part 3). I am so genuinely stoked about the path we’ve found ourselves on, that yesterday afternoon I almost asked the girl at the pork store if she could believe that Quality Starts were so highly correlated to Starting Pitcher End of Season Position Ranks in Fantasy Point Leagues (exhale). I mean at this point it had to be all over social media, right? Trending worldwide? Would I be dodging swaths of sabermetric paparazzi on my way back to the car? Well, it was not, I was not and I didn’t even end up asking her. I just took my hot soppressata and left (it’s pronounced soo-pah-sad for all my non Brooklyn born baseball lovers).
Now that I’ve successfully referenced my favorite cultural salted meat, its time to get back to work. To quickly recap, we left off with all Starting Pitchers in 2018 with at least 20 Quality Starts (15 Players) and tested for correlation with that pitcher’s finishing rank by position in each format…
| PLAYER | QS | Point Finish | Roto Finish |
|---|---|---|---|
| Max Scherzer SP | WAS | 28 | 1 | 3 |
| Jacob deGrom SP | NYM | 28 | 3 | 24 |
| Justin Verlander SP | HOU | 26 | 2 | 6 |
| Corey Kluber SP | CLE | 25 | 4 | 2 |
| Aaron Nola SP | PHI | 25 | 6 | 5 |
| Kyle Freeland SP | COL | 24 | 15 | 10 |
| Mike Clevinger SP | CLE | 21 | 14 | 18 |
| Zack Greinke SP | ARI | 21 | 16 | 12 |
| Gerrit Cole SP | HOU | 20 | 5 | 8 |
| Clayton Kershaw SP | LAD | 20 | 28 | 44 |
| Trevor Bauer SP | CLE | 20 | 12 | 19 |
| Jameson Taillon SP | PIT | 20 | 20 | 23 |
| German Marquez SP | COL | 20 | 18 | 14 |
| Miles Mikolas SP | STL | 20 | 13 | 13 |
| Dallas Keuchel SP | HOU | 20 | 32 | 31 |
-
Rotisserie –0.46. This is between a weak and moderate linear relationship, and it’s within reason to argue that in combination with our previous work that we can safely bury the use of QS in Roto research (at least for now). I do believe if we extended the sample, the correlation will strengthen simply for the fact that the QS is a measure of success, regardless of varying degree. Later on in coming articles I will circle back to this for another test. This time, I will aim to define another custom QS based stat that I believe we will be able to correlate heavily to finish rank; So stay tuned Roto crowd, I got you.
-
Points –0.73. This is between a strong and perfect linear relationship, and it’s beginning to validate our initial assertion.
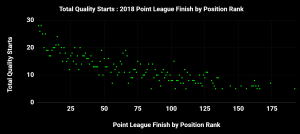
I found it particularly interesting that when we extended the sample size to all Starting Pitchers that had at least 5 Quality Starts (142 Players), that the correlation actually strengthened to -0.83! I polished the rust off of my scatter charts to give a visualization of this (found below). We can take a collective deep breath, puff out our chests and assert with statistical backing that yes, in fact, Quality Starts are linked to position finish in Point Leagues. Our initial assumptions being proved correct, it’s time for the fun stuff. What’s that you ask? BOURBON!… AND LOTS OF IT! No no, I kid. The answer is actually more stats and charts (wompitty womp womp).
The simple and lazy way out of this would be to just draft our Starting Pitchers by Total Quality Starts and let it play out. Well I may be simple, but I sure as hell am not lazy. I’m grabbing some rations and watering the horses for the next leg of our now indefinitely extended exploration north of the wall. This is where our ability to think critically and retain information while continuing to progress forward is essential.
These exercises of thought always harken me back to one of my personal favorite personalities & intellectual minds, Michael Lebron (aka the L Train). During lectures he often refers back to Eric Brenn, better known as the plate spinner on the Ed Sullivan show. I know exactly what you’re thinking; How can I possibly reference a variety show that ended over a decade before I was even born? The analogy is so perfect that it will not only benefit you here, but it will also lend perspective to parts of your life outside of baseball analytics. Eric Brenn would spin a plate, and that would allow him to move on to the next one, providing he did not ignore the initial one for so long that it stopped spinning. This is exactly what we must do. We must press forward while retaining our pertinent discoveries, but be ready to readdress at any time. We may have to stop abruptly to correct or define a variable or nuance in order to proceed. So be it. Our work here is pioneering for the oft ignored H2H Point League, and could potentially lead us down some dead ends; What remains paramount is not getting discouraged or losing track of our prior realizations.

Where do we go from here? That’s a tough one. My gut feeling is to start directly in the eye of this Sharknado, by pulling threads on these referenced Quality Starts to see whether or not they begin to unravel. Since Quality Starts are conceptually tied to wins, which also earn points, I think that’s a logical place to start looking. While that plate is still spinning, I want to pivot real quick and address something I’ve been hearing off line. A few complaints pointed at me expressed concern at not using the entire 2018 game set. It reminded of crucial points recently made by a true titan in the baseball multiverse; Podcast hero and baseball genius Joe Pisapia. Joe was kind enough to spend a few minutes of his absurdly busy day with me on the subject (after I got all greased up and slid right into his DMs). He is truly one of the greatest guys you’ll ever interact with, and if you don’t follow his work it’s not only unique but essential (BLAAAAAACK). I’ll paraphrase our conversation; I feel it shares a very important foundation with our exercise here. The initial debate I’m referring to was between Joe Pisapia and another stud in the sabermetric space, creator of The Bat Derek Carty, on the most efficient sample set when calculating the effect of walk year contracts (I absolutely recommend you check out the thread on Twitter, I could not do either of these gentleman justice tackling it here). Regardless of my stance on the topic, where I will plant my flag is on the critical nature of deciding the necessary sample. I not only agree with Signore Pisapia but want to heavily stress Joe’s two major points. The first is that cause and effects in baseball are often more nuanced than collecting totals. This leads right to the second point, maintaining focus on the goal at hand. In Joe’s case it was eliminating aging players or optioned rookies, etc. In our case it’s eliminating anything like openers, spot starters or one time September callups; Anything that may take us away from our focus, Fantasy Baseball Championships (and to a lesser degree insulting our friends’ knowledge of the game). Crushing stats is awesome, no doubt about it. However we must not lose the forest for the trees, and remain fantasy centric. We have a job to do, and money to make. Remember, diapers are expensive, and so are sports cars. Thank you Joe for your time and all credit to you for helping me cauterize this.
In order to eliminate some of the aforementioned noise surrounding our stats (using openers, spot starters, etc.), I’ll be using that same sample of 142 starters with a minimum of 5 QS in 2018 that yielded the very strong -0.83 correlation between QS total and position finish. These are the pitchers we care about; The ones we draft in March or add mid-season. This will allow us to keep our information as fantasy relevant as possible. Let’s set some given information. Here’s what we know so far …
- Of all 4862 starts made in 2018, 2011 or 41.36% were Quality Starts
- When focusing on just those 152 Starting Pitchers with at least 5 QS; 3762 starts were made, 1803 or 47.93% were Quality Starts
Ok that’s nice Mr. MLB Moving Averages, but what percentage of those games are converted into wins for the Starting Pitcher? Well, let’s look it up hot shot….. Googling….. Binging….. Yahoo-ing….. Firefoxing….. Fangraphing….. Baseball Referencing??? Nothing, nada, niet, non, nee, nan, nej, nein. This is a baby-powder covered hand heading full speed for the cheek of the entire points playing community (COME ON WIT IT!). Of all the work we’ve done, this has to be the most astonishing part of this exercise to date and I’m glad to be sharing it with you in real-time. How could, without exaggeration, the most crucial statistic in our universe NOT EVEN BE RECORDED?!?! I FEEL LIKE I’M TAKING CRAZY PILLS!!! If you’ve been with me since the beginning, then you know that this injustice can not, and will not stand. I literally had to hand mine and sort all of this data coming up. This next stat should (but won’t) provide comfort to the deflated H2H player watching that tying run go sailing into the stands off your Starting Pitcher’s replacement.
- Our qualifying 142 Starting Pitchers gave us 1803 Quality Starts. Only 995, or 55.19% of those games ended in a win for the starter (Yes, that’s right and it should make you appreciate the Quality Start plus Win even more).
Just in case I did invent all of this Quality Start stuff, you’re all very welcome. And if so, do astrological rules apply? Does that mean I get to name it? For the sake of simplicity we will refer to the holy grail of H2H as a QSW (QS+W) though in reality between small batch, barrel strength bourbons I do usually refer to it as a Combo Meal (Note to the arbiters of baseball truth and research if ever deciding to add me to the annals of the MLB statistical history books. I gladly accept the honor). Let’s take a look at the top of the 2018 QSW leaderboard and where those players finished; Only 8 pitchers had 15 or more Combo Meals during the 2018 season.
| NAME | QS | QSW | PT RANK |
|---|---|---|---|
| Kluber, Corey CLE | 25 | 20 | 4 |
| Nola, Aaron PHI | 25 | 17 | 6 |
| Snell, Blake TB | 19 | 17 | 7 |
| Scherzer, Max WSH | 28 | 16 | 1 |
| Freeland, Kyle COL | 24 | 16 | 15 |
| Cole, Gerrit HOU | 20 | 16 | 5 |
| Mikolas, Miles STL | 20 | 16 | 13 |
| Verlander, Justin HOU | 26 | 15 | 2 |
Quick analysis of this information before we drop the curtains until next time:
- In this case the sample is too small to run a correlative analysis in my opinion, but from my point of view the message here jumps off the page. Simply stated, find yourself a pitcher thats a leader in QSW and you found an SP1 in H2H formats.
In the next article we’ll extend our research into the QSW leaders, and where it places them in the finishing ranks. I’ll also introduce a new custom QS conversion stat that will help us not only in understanding, but in our draft day execution. Never forget, life is a fantasy draft.
Thanks again for sticking it out with me through the hootin’ and the hollerin’. I hope you all learned something, and even had some fun doing it. Please feel free to comment or contest, and follow my work on Twitter MLB Moving Averages @MLBMovingAvg.