On Wednesday night, I turned on a close game between the Houston Astros and Toronto Blue Jays in the ninth inning. The Astros were ahead 2-1 in the top of the inning with two men on base. Up to bat was Yordan Alvarez, perhaps the greatest hitter on the planet this season. The Blue Jays had already walked him twice in the game, but with a man on first and second, there was nowhere to put him in this situation. Showtime, I thought.
Yordan would hit into a force out, but Jeremy Pena put up an insurance run in the next at-bat, and the Astros won 3-1. It was not what Yordan Alvarez wanted to happen, of course, but more interestingly, it was not what I EXPECTED to happen. He has been so dominant this season that I was certain he would do something incredible when the Blue Jays were forced to pitch to him.
Heading into Wednesday, Alvarez was hitting .325/.436/.640 with 25 home runs, 56 RBI, and 57 runs. In the Triple Crown Categories, Alvarez was second (average), first (home runs), and second (RBI). But according to the latest data available from Statcast, Yordan Alvarez is actually underperforming based on what his batted ball metrics tell us he should be doing! Is that even possible? Let’s find out.
Alvarez’s Numbers Are Elite, But Statcast Says They Should Be Historic
Statcast uses a lot of different data points to measure its Expected Statistics. Is that a perfect or predictive stat? No, it presumes a lot of things based on what has been done in the past, not necessarily what will happen in the future. But if we are to believe that Yordan Alvarez spent the first half of the season hitting like Ted Williams, we would assume that would continue in the second half if there is good health, right?
The Expected Statistics page for batters is a fascinating look at the 2026 season. Michael Harris II and Blaze Alexander are in the top five in expected batting average. Alec Burleson is in the top 10 for expected slugging percentage. But you can also show the leaders in the difference between expected numbers and actual numbers for batting average, slugging percentage, and wOBA. Care to guess one of the players who shows up in the largest positive difference between his expected slugging percentage and actual slugging percentage, and his expected wOBA and actual wOBA?
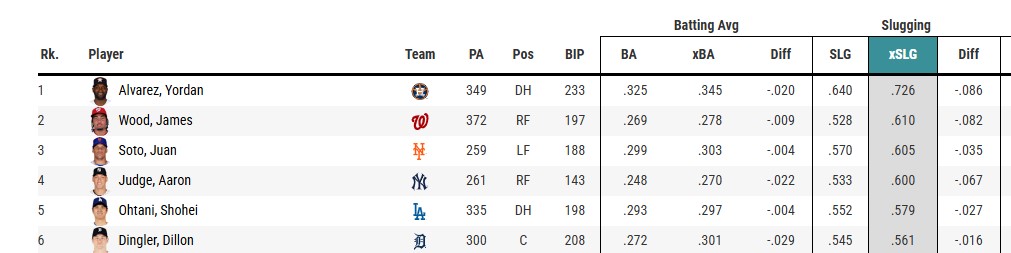
Despite leading the entire universe in slugging (.640, or 44 points higher than the next batter), his expected slugging is an astronomical .726, an 86-point difference. No other player is above a .610 expected slugging. His batting average is .325, but his expected batting average is .345, the highest in the league by over 30 points.
A potential .345 average and .725 slugging percentage over more than 350 plate appearances. That’s truly insane. I got to wondering about how many players have done that over the last 50 years (Babe Ruth did it like seven times). Fifty years seems like the modern timeframe, so let’s narrow our search to that.
According to Stathead, these are the only times it has been done:
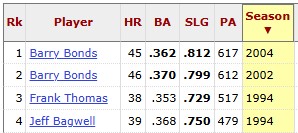
Four times in the last 50 years (and it’s actually four times in the last 70 years). Two Barry Bonds seasons and the historic Frank Thomas and Jeff Bagwell 1994 seasons that were cut short by the player strike. Now, Alvarez’s numbers are hypothetical and not actual, but this is the type of production we could see out of Yordan Alvarez in the second half of the season.
Can Yordan Alvarez Possibly Get Any Better?
Is it possible we could see Alvarez achieve better numbers in the last three months of 2026? Let’s dig into some of his underlying metrics this year to find out. First, we will start with batting average on balls in play (BABIP). This year, he is hitting .332. That’s a very high mark, but he is at .321 for his career, so he isn’t totally out of bounds there.
What about walk rate and strikeout rate? Essentially, how well is he seeing the ball? His walk rate (15.2%) is the best of his career, and his strikeout rate (16.6%) is identical to 2025. Nothing to worry about here. Could he be chasing too many balls, or not making enough zone contact? His chase rate in 2026 is identical to 2025 (26.7%). His zone contact rate is up by three percentage points, so it’s possible there could be a slight regression there.
His home run per fly ball rate is 22.5%, which is among the league leaders. But he is at 21.2% for his career because he is a freaking beast.
Essentially, there is nothing incredibly fluky in Alvarez’s profile that would sway us from thinking he will start to negatively regress. So what’s left is that his performance could actually be maintained or improved in the months to come.
One other thing jumped out as I did the analysis. That force out that Alvarez grounded into on Wednesday was quite a rare occasion. Perhaps what is driving his success this year is that he has basically stopped hitting ground balls. His 27% ground-ball rate is second only to Cedric Mullins and Kyle Schwarber in the league.
This appears to be the year he is putting everything together, and we should just enjoy the ride (which could get better!) while we can.