

I’m back again. Since we are still in Halloween mode, I am going to continue the monster theme from my last post whether it is corny or not. I’m resuming my project, but shifting my focus to my newest creation, a mutant called CoorsZilla. This biologically engineered creature was constructed from the scrap heap, along with some leftover material from my FrankenSac work. Like FrankenSac, it was built from players rostered in fewer than 50% of Yahoo leagues. Again, I chose outfielders only because they’re more readily available than other positions and generally have higher replacement value (more on that later). The one catch: I only used outfielders playing at Coors Field over the 2026 season.
Coors is no slouch when it comes to park factor. It has one thing that Sacramento does not: a long-standing tradition of inflating BABIP and being a hitter’s paradise. In fact, it’s been considered the gold standard of hitting environments. Many have thrived there. Well, maybe everyone except Kris Bryant.
Experiment Parameters
- I selected outfielders only from the visiting teams playing the Rockies, according to the schedule. No Rockies player was eligible.
- The outfielders were used only during their visit to Coors Field and were considered only if they were rostered in fewer than 50% of Yahoo leagues, often at a much lower percentage.
- There was no cherry-picking by looking at box scores and stats ahead of time. Selections were made strictly off the schedule based on known availability and ownership qualifications.
- If a player chosen for my experiment did not play in a game, I swapped in another outfielder (a warm body) from the same team who played and met the same ownership threshold.
- If I could not find a player on that specific team that I knew was under the threshold, I left the game as a DNP (did not play), which is why CoorsZilla played in 77 games instead of 81.
- The final box scores for each game were pulled from Baseball-Reference.com using batter game logs.
Outfielders Used
CoorsZilla consists of more outfielders than FrankenSac did, so it was a little more complicated to construct. It is composed of 32 players. Yes, 32 players. I’ll circle back to that.
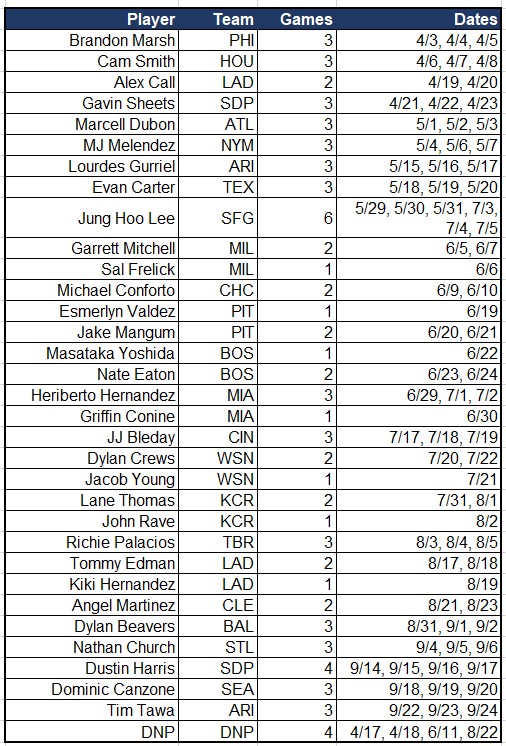
Aggregate Stats
Now the moment of truth. Here are the combined stats of CoorsZilla. Similarly, I’m only using the standard 5×5 roto categories for this experiment.
- 77 games: 46 Runs, 7 HRs, 45 RBIs, 6 SBs, .323 BA.
For ease of math, let’s just double the totals to annualize the production. Keep in mind, the comparison is about pace for half a season. The doubling is just a way to compare that production to the full-season Player Rater.
- 154 games: 92 Runs, 14 HRs, 90 RBIs, 12 SBs, .323 BA.
Something must have gone wrong. I think my mutant is from another era (that’s not earned run average) because nobody puts up stats like this anymore. I could not find anyone remotely close to it this year. It’s a clone of circa early 1990s Mark Grace! That’s not exactly bad. Let me see if I can find someone more current. Luckily, I found a link to this relic. It’s a Razzball recap post from 2018. What a gem. We will use that as our estimate for CoorsZilla, since it serves as a way for us to benchmark where it would land vs. outfielder performance.
- Michael Brantley (2018): 89 Runs, 17 HRs, 76 RBIs, 12 SBs, .309 BA.
While light on RBIs and BA, Brantley was fairly close to this creation, but in reality CoorsZilla was better. Close enough, though. Brantley ranked as the 14th outfielder that year. My mutant virtually replicated that kind of production for half a season! Honestly, I was surprised CoorsZilla didn’t hit more HRs given the high-altitude environment. Maybe we can remedy that. On to the next phase of this experiment.
Experiment Phase II
Like I said before in my last post, I know what you are thinking. This is only for 77 games. How much is that going to help me? What about the rest of the season? This is where I want to touch on replacement value again. According to my definition, replacement value is very simply a baseline value or level of production that you can get without cost from the waiver wire (free agents) or the scrap heap, as I have referred to it. It’s basically what is available in the typical replacement player pool. It can also be a late-round draft pick who is most likely not widely drafted unless you play in super-deep formats. Outfielders, due to their abundance, generally have more replacement value. Position scarcity comes into play. The deeper the player pool, the higher the replacement value. Pretty simple, right?
Let’s get back to the experiment. To borrow a Tim Allen reference, this thing needs more power. Well, it just so happens that I have some organic material left over from my previous experiment. Cam Smith, where are you? What would happen if I infused more of Cam Smith into CoorsZilla? Why Smith again, you ask? Admittedly, I am being lazy again. Smith technically makes up 4% of CoorsZilla already (3 of 77 games), and I know he meets the ownership threshold. I also know he has some power, but more importantly, I have his data already from my last post and it will save me time. How convenient.
Filling in the Gaps for a Full Season
Based on the data above, we know what CoorsZilla did for those 77 games. So, I ran the experiment, using Cam Smith in the games CoorsZilla did not play. That includes three of CoorsZilla’s DNP games, on 4/17, 4/18 and 8/22. Two games were also backed out of Cam Smith’s total where he did not start and came in later, but did not receive a PA (7/27 and 8/16).
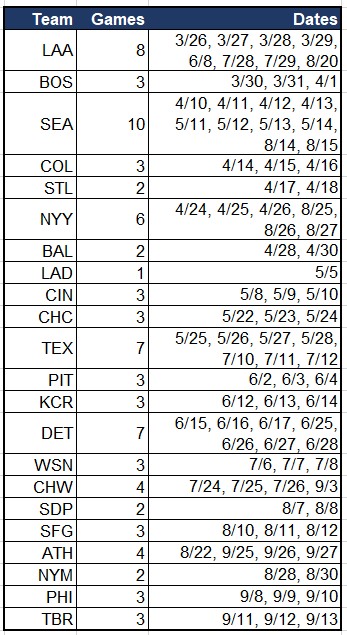
Cam Smith put up the following stats in those games:
- 85 games: 42 Runs, 13 HRs, 35 RBIs, 7 SBs, .202 BA.
Once we add CoorsZilla’s production over 77 games, we get a full-season line of:
- 162 games: 88 Runs, 20 HRs, 80 RBIs, 13 SBs, .261 BA.
Look at that production over the season. Let’s call this mutation Cam CoorsZilla. How does this line up on the Player Rater and who does it best compare to in 2026?
- Bryan Reynolds: 102 Runs, 17 HRs, 72 RBIs, 9 SBs, .261 BA.
The closest match I could find in 2026 was Reynolds. I created a mutation of Bryan Reynolds with more HRs, RBIs and SBs. Reynolds scored more runs, but let’s call it even, since the 14-run shortfall is offset almost equally by gains in HRs, RBIs and SBs. You may call Reynolds meh or even boring, but he finished #79 on the Player Rater and ranked as the 21st outfielder. Most importantly, Cam CoorsZilla was basically free.
Experiment Phase III
I said in my last post that I really did not try to optimize anything, but what if we dial it up a notch and mix in a better outfielder than Smith who met the ownership threshold? How about Dominic Canzone? He was rostered in 27% of Yahoo leagues. Canzone had an ADP of 334 in the NFBC, so he probably wasn’t even drafted in most mixed leagues. He could have easily been your fifth outfielder that you held all season or picked up for free out of the scrap heap. Canzone finished #150 on the Player Rater and ranked as the 38th outfielder. Coincidentally, Canzone also made up 4% of CoorsZilla (3 of 77 games). Canzone is just one example of the many outfielders drafted late, or not at all, who could have worked.
Filling in the Gaps Again for a Full Season
I ran the experiment, using Dominic Canzone in the games CoorsZilla did not play. That includes all four of CoorsZilla’s DNP games (4/17, 4/18, 6/11, and 8/22).
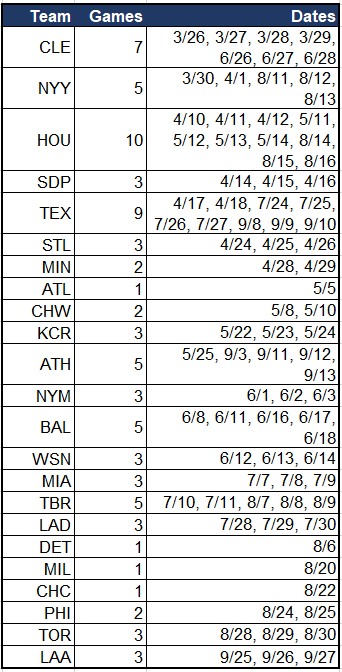
Dominic Canzone put up the following stats in those games:
- 83 games: 36 Runs, 15 HRs, 51 RBIs, 2 SBs, .290 BA.
Once we add CoorsZilla’s production over 77 games, we get a full-season line of:
- 160 games: 82 Runs, 22 HRs, 96 RBIs, 8 SBs, .307 BA.
Now that’s looking even better. I call this mutation Dom CoorsZilla. How does it line up on the Player Rater and who does it best compare to in 2026?
- Michael Harris: 79 Runs, 26 HRs, 87 RBIs, 12 SBs, .294 BA.
- Freddie Freeman (2025): 81 Runs, 24 HRs, 90 RBIs, 6 SBs, .295 BA.
Harris was the closest this year and he finished #42 overall on the Player Rater and ranked as the 11th outfielder. My creation was virtually in line with him. Harris had a few more HRs and SBs, but Dom CoorsZilla had more Runs, RBIs and a better BA. Freeman lined up closely too in 2025, good for #40 overall on the 2025 Player Rater. We essentially created a top 40 player from the scrap heap with one late draft pick or possibly a free agent pickup, and a supporting cast of streamers. There is not a single person reading this post who couldn’t have used a free jolt like that.
Conclusion
I am not going to repeat my previous conclusion verbatim, but will reiterate that plus hitting environments can and should be exploited.
We can create our own monster for essentially zero cost, and it has several ancillary benefits. As I said in my last post, this approach can help us reduce the opportunity cost of deferring that fifth outfielder, or of taking a closer or starting pitcher earlier than normal.
We can generate better production this way. We do not even have to use as many streamers as I did to make this approach effective. Let’s say we become more selective and cut the mix of players down to 10 to 15. We can pick the better streamers since some of them are clearly more attractive than others. It will still lead to a boost in production vs. using only Smith or Canzone over the full season.
Thanks for reading. I am done in the lab and will resume normal programming. If only I could get my hands on some of that cryogenic Ted Williams DNA. Stay safe and enjoy your Halloween. You can also find me on X at @Toolsy3.

Interesting, thank you! Food for thought for 2027!
Perhaps a future experiment could be 2-3 OF spots comprised entirely of this approach.