

Halloween is approaching. It’s one of my favorite holidays. I have fond memories of it as a kid, and I still enjoy it as an adult. The monsters, decorations, scary movies, and classic cartoons are fun and nostalgic. I like seeing the little kiddos trick-or-treating. The costume parties aren’t too bad either, but before I lose focus, back to the monsters.
One of the most iconic monsters is Frankenstein’s creation, assembled by a scientist from what I’ll call spare parts. We know the story. With that backdrop in mind, I conducted my own experiment. I am calling my creation FrankenSac. I shopped at the thrift store, hit the junkyard, and collected as many spare parts as I could find. Hell, I even did a little dumpster diving and made a trip to the landfill, where I unearthed what many of you would call trash. I built my monster from players rostered in fewer than 50% of Yahoo leagues. I chose outfielders only because they’re more readily available than other positions. The one catch: I only streamed outfielders for my experiment in Sacramento (and Las Vegas) over the 2026 season.
I’ve called Sutter Health Park a hitter’s haven and a paradise. I even called it Valhalla. In my early 2027 rankings, I talked up the park and pushed up all the A’s outfielders because of it. No sweat if you don’t read my stuff or don’t believe me. Grey talks about it too. He calls it Bing Bong, and there’s a reason for that: it’s a launching pad and, by far, the best stadium in terms of park factor.
Experiment Parameters
- I selected outfielders (spare parts) only from the visiting opponents playing the A’s, according to the schedule. No member of the A’s was eligible.
- The outfielders were used only in Sacramento, plus the two 3-game series the A’s played at their AAA affiliate’s stadium in Las Vegas, another favorable location. That park is approximately 13 miles from where the A’s new home will be in 2028.
- The outfielders were only considered if they were rostered in fewer than 50% of Yahoo leagues, often at a much lower percentage.
- There was no cherry-picking by looking at box scores and stats ahead of time. Selections were made strictly off the schedule based on known availability and ownership qualifications.
- If a player chosen for my experiment did not play in a game, I swapped in another outfielder (a warm body) from the same team who played and met the same ownership threshold.
- If I could not find a player on that specific team that I knew was under the threshold, I left the game as a DNP (did not play), which is why my experiment ended with 79 games instead of 81.
- Seven teams never visited SAC or LV and were not included in my experiment: ATL, NYM, PHI, CHC, CIN, ARI, SDP.
- The final box scores for each game were pulled from Baseball-Reference.com using batter game logs.
Outfielders (Spare Parts) Used
I ended up bringing my creature to life using 24 bodies over the course of the season. I’ll get to the results momentarily.
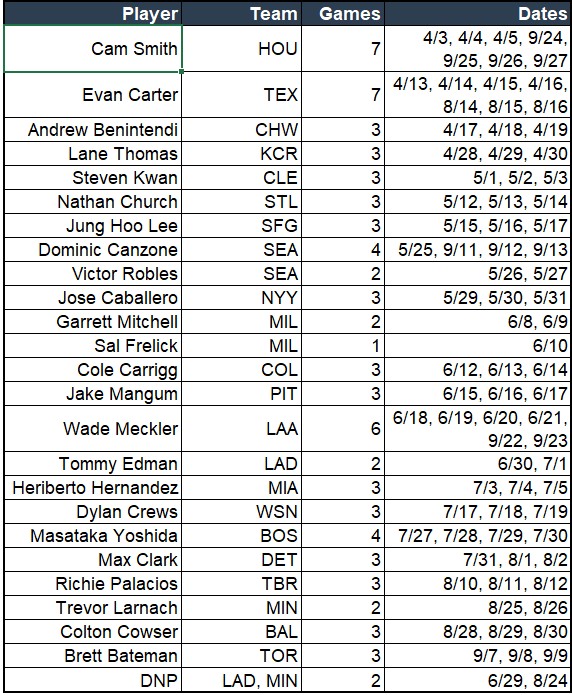
The only guy on this list who ended up over 50% owned is Steven Kwan, and that’s because he got hot in the second half. If you recall, he was struggling for the entire first half. He was under the threshold when I used him for my experiment. For the record, he was hitting .221 with 11 Runs and 2 SBs over his first 30 games (not exactly setting the world on fire) before making that trip to Sac Town.
Aggregate Stats
Now the moment of truth. Here are the combined stats of FrankenSac. Note: I’m only using the standard 5×5 roto categories for this experiment.
- 79 games: 52 Runs, 14 HRs, 39 RBIs, 6 SBs, .305 BA.
For ease of math, let’s just double the totals to annualize the production. Keep in mind, the comparison is about pace for half a season. The doubling is just a way to compare that production to the full-season Player Rater.
- 158 games: 104 Runs, 28 HRs, 78 RBIs, 12 SBs, .305 BA.
Without digging too deep, here is the closest comparison I found:
- Michael Harris II: 79 Runs, 26 HRs, 87 RBIs, 12 SBs, .294 BA.
While a little light on runs and average, Harris had a few more RBIs, so let’s say it roughly evens out, but in reality my creation was better for half a season (more runs and a better average, essentially flat on HRs, even on SBs). Harris finished #42 on the Player Rater and ranked as the 11th outfielder. That puts FrankenSac’s pace in the neighborhood of #42 overall. My pile-of-scraps creature virtually replicated that kind of production for half a season!
Experiment Part II
I know what you’re thinking… “That’s just great. It’s only for 79 games. What do we do about the other games? That isn’t going to help me that much.” Fair argument, but that is where replacement value comes in. As I mentioned, I chose outfielders only for this experiment because of their availability and higher replacement value. There are more starting outfielders relative to other positions, so generally speaking there are better options as free agents or more productive draft picks that you can get later on. They may have some warts and may even be viewed as bargain-bin or garbage picks, but you can get them late in the draft or pick them up off the scrap heap.
With that in mind, I conducted the second part of my experiment: fusion. No, not nuclear fusion. I’m blending another player into my creation to get a full season of stats. I arbitrarily selected Cam Smith as my test subject. Why Cam Smith? Honestly, it was simply because he appeared first on the table above, and I was feeling lazy. He technically makes up 9% of FrankenSac already (7 of 79 games), which made the experiment easier to conduct. I knew Smith met the experiment requirements: he’s only 10% owned now and was available virtually everywhere. He had an ADP of 308 in the NFBC, so he was probably drafted even later, or not at all, in most mixed leagues. Smith finished #251 on the Player Rater and ranked as the 63rd outfielder.
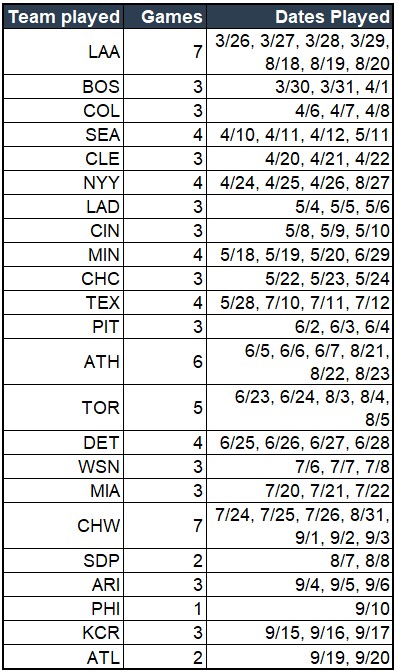
Filling in the Gaps for a Full Season
Based on the data above, we know what FrankenSac did for those 79 games. So, I ran the same type of experiment, using Cam Smith in the games FrankenSac did not play. That includes one of FrankenSac’s DNP games, on 6/29.
Fusion Results
Now we get to the fun part: what happens when I blend FrankenSac and Cam Smith together?
Cam Smith put up the following stats in those games:
- 83 games: 30 Runs, 12 HRs, 29 RBIs, 8 SBs, .205 BA.
Once we add FrankenSac’s production over 79 games, we get a full-season line of:
- 162 games: 82 Runs, 26 HRs, 68 RBIs, 14 SBs, .257 BA.
Look at that production over the season. Let’s call this fused-creation Cam FrankenSac. How does this line up on the Player Rater and who does it best compare to in 2026?
- Wilyer Abreu: 81 Runs, 24 HRs, 76 RBIs, 8 SBs, .248 BA.
I basically created a clone of Wilyer Abreu with a few mutations: more steals, a better BA, and slightly fewer RBIs. Abreu finished #104 on the Player Rater and ranked as the 26th outfielder. My pieced-together fusion experiment would land in the same neighborhood, and likely even higher, on the final rankings, perhaps cracking the top 100. That’s not too bad. And remember, I never tried to optimize any of this. I went down the schedule and took a qualifying player for each series. I could easily make an argument that the results could be even better had I picked a more productive, widely available outfielder as my test subject instead of Cam Smith.
Conclusion
What does this mean? It means maybe we should rethink how we value park factor when parks are true outliers. Sacramento qualifies. Mexico City does too. Coors is another plus environment that we can and should exploit.
I think we all could have used an extra outfielder or another productive hitter in our utility spot for half a season. The cost of this pieced-together outfielder was virtually zero.
There are some ancillary benefits of this approach. We may not have to worry as much about drafting that fifth outfielder, or we may be able to defer the need to take one. We might be able to afford to pay up for a closer or take one earlier than usual (I hate paying too much for a closer, so let’s not go crazy) without panicking about leaving a productive hitter out there. I have shown that you can mitigate the opportunity cost of deferring that fifth outfielder, or of taking a closer or starting pitcher earlier than normal, by creating a monster of your own. Go ahead and give it a try.
Thanks for reading. I enjoyed putting this piece together. Have a happy and safe Halloween. I may also do another one of these experiments if I’m allowed out of my cage in the lab, where I’m starting to study some kind of mutant I’m calling CoorsZilla. You can also find me on X at @Toolsy3.
