
Before we fasten our pocket protectors and bust out the graphing calculators, I’d like to thank everyone in the Razzball universe for reading, supporting, and responding. I’ve learned as much from you as you have from me. This experience has really been a lot of fun, and I truly feel like we’re doing very important work that started in Part 1, Part 2, Part 3, and Part 4 for the H2H space. I believe this will lead to developing an edge come draft day. Welcome to the QS Thunderdome. Two stats enter, one stat leaves!
Quick recap so we can keep the pertinent numbers from our previous work in front of us:
- 142 qualifying Starting Pitchers (minimum of 5 QS pitched in 2018) gave us a total of 1803 Quality Starts. Only 995, or 55.19% of those games ended in a win for the starter.
When I first saw this number, granted I didn’t fall of my chair but I was really surprised it wasn’t a lot higher. Should I have been, though? Probably not; Wins are notoriously sketchy for being overly tied to extraneous circumstances. They’re hard to pin down and harder still to predict. However, I have a reputation of being thorough to maintain, so let’s run some correlative comparisons on Quality Starts + Wins to point finish rank by position. Maybe we will discover something outside of the widely accepted assertions about Wins. Beginning with the broadest brush, pictured below is our new entire set of QSW data transposed on the existing QS scatter chart. If your initial reaction is that they look almost identical, you would be correct.
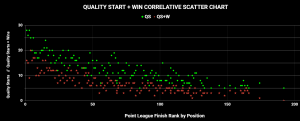
- There is an extremely strong -0.830 negative correlation between Quality Starts & Point Finish by Position Rank (Please see Parts 3 & 4 for the work that lead us here).
- There is a nearly identical negative correlation of -0.820 when we substitute QSW for simple QS. However, something here smells fishy to me.
On the surface, this seems intuitive and potentially convincing enough (for some) to move on with a bland conclusion. The easily satisfied fantasy analyst could assert that with our Quality Starts, must come Wins, which explains how the two appear to be linked so closely. That being said, we already know through our calculations that only 55.19% of our Quality Start sample actually resulted in a Win for that Starter. The apparent link in the two statistics is misleading. The skeptic in me will not be satisfied unless we go deeper. There’s something missing. Let’s dissect the variance in correlations as the QSW values change, and look for notable trends.
- Of all Starters in 2018 (138) with 3+ QSW : -0.806
- Of all Starters in 2018 (98) with 5+ QSW : -0.770
- Of all Starters in 2018 (64) with 7+ QSW : -0.720
- Of all Starters in 2018 (40) with 9+ QSW : -0.572
- Of all Starters in 2018 (27) with 11+ QSW : -0.634
- Of all Starters in 2018 (13) with 13+ QSW : -0.612
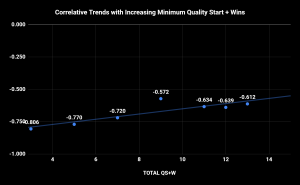
The chart above certainly confirms our current suspicions; The apparent relationship only exists on the surface. As we widen our spectrum, the correlation remains nearly linear on our plotted chart, only strengthening to a point of validity when almost the entire sample is involved. Keep in mind that this tricky, faux correlation does make sense intuitively. A QSW is a double scored event; One of the main reasons it can be so difficult to quantify for point league purposes. In this case, if a pitcher gets fortunate with his Quality Start + Win Conversion Rate (QSWC%) and walks into a few worst case QSWs (6IP, 3ER), an otherwise below average pitcher could get a big relative boost as far as point finish (By the way, more custom point stats you will only get here or @MLBMovingAvg). So what pitchers might have had an unsustainable result? Are they being overvalued in points leagues unknowingly? Do they share anything in common that we might look to draw upon in the future?
I’ve gathered and sorted the Quality Start + Win Conversion Rate of our 2018 Starting Pitcher sample. It turns out that only 20 pitchers in all of the majors with at least 5 Quality Starts were able to convert at least 75% of QS into Wins. Let’s analyze the leaderboard and see what we can see.
| NAME | QS | QSW | QSWC% |
|---|---|---|---|
| Gonzales, Marco SEA | 13 | 13 | 100.00% |
| DeSclafani, Anthony CIN | 5 | 5 | 100.00% |
| Montás, Frankie OAK | 5 | 5 | 100.00% |
| Snell, Blake TB | 19 | 17 | 89.47% |
| Bieber, Shane CLE | 8 | 7 | 87.50% |
| Rodríguez, Eduardo BOS | 7 | 6 | 85.71% |
| Quintana, José CHC | 13 | 11 | 84.62% |
| Peralta, Freddy MIL | 6 | 5 | 83.33% |
| Kluber, Corey CLE | 25 | 20 | 80.00% |
| Cole, Gerrit HOU | 20 | 16 | 80.00% |
| Mikolas, Miles STL | 20 | 16 | 80.00% |
| Happ, J.A. NYY | 15 | 12 | 80.00% |
| Godley, Zack ARI | 14 | 11 | 78.57% |
| Stripling, Ross LAD | 9 | 7 | 77.78% |
| Eflin, Zach PHI | 9 | 7 | 77.78% |
| Gray, Jon COL | 13 | 10 | 76.92% |
| Severino, Luis NYY | 17 | 13 | 76.47% |
| Porcello, Rick BOS | 16 | 12 | 75.00% |
| Newcomb, Sean ATL | 16 | 12 | 75.00% |
| Gray, Sonny NYY | 8 | 6 | 75.00% |
The underlying stats suggest that at least of half of the Converted Quality Starts + Wins above average will be lost for these starters. This is a unique take on predicting outcomes for the upcoming season and I will be definitely adding this stat to my checklist before drafting point pitchers. Now not to purposely cherry pick (there are lessons hidden within these anomalies), but Marco Gonzalez is getting a lot of love going into draft season. He finished as SP43 in H2H Point formats, sporting lots of slightly above average, and very pedestrian stats from 2018. Steamer Projections for 2019 agree.
- 2018 ERA – 3.77
- SIERA (Skills Independent ERA) – 3.81
- DRA (Deserved Run Average) – 3.58
- WHIP – 1.22
- K-BB% – 16.5%
- Steamer ERA – 4.08
- Steamer FIP – 4.18
- Steamer xFIP – 4.17
If we were to adjust Marco’s Quality Start + Win Conversion % back to the league average of 55.19%, he could have easily had 6 less wins which would have cost him over 20 slots as far as position rank. I think this development warrants a similar inspection under this specific lens for any pitchers we expect to draft. In coming articles we’ll get down and dirty with split variations of these same stats to identify late values or possible productive player pairs ( There I go with those custom stats again, make sure to tell your friends).
Before we get out of here for the time being (after another productive and enlightening segment), I’m briefly going back to the QSWC% leaderboard to comb over one more time for anything we might have missed to be addressed next time we meet. If we establish a link between these 20 pitchers’ outcomes, it could help us better maximize our ability to acquire the elusive QSW in the future. Bullpens are full of variables, nuance and context; But it never hurts to overturn every stone we encounter for the sake of certainty.
From the broadest viewpoint, the safest assumptions in regards to these findings are that being attached to good bullpens and/or winning teams lead to delicious, mouth-watering Combo Meals. It turns out that 65 %, or 13 of those 20 pitchers were on teams whose bullpen was in the top 10 of 2018 ERA. 6 of the remaining 7 played on teams with at least 88 wins (.543 Win %). However superficial, these discoveries are critical in our final projections and consideration for draft day. Another box to check as we whittle away our list of our favorite Starting Pitchers. We know now it is crucial to weigh not only the team, but the bullpen also in addition to focusing on Quality Starts in our point pitcher evaluation.
As always, it’s been a blast. We continue making progress as we push point league analysis to the forefront of an ever-changing fantasy landscape, and we won’t stop here. Please make sure to comment with thoughts and witticisms, pushbacks and criticisms. And remember, life is a fantasy draft.
Please feel free to comment or contest, and follow my work on Twitter MLB Moving Averages @MLBMovingAvg.