Something, something, COVID-19, something. I feel bad for the Wuhan Clan, the tribute rap group, they are going viral for all the wrong reasons right now; and sadly, their music is being grossly underappreciated. Channeling my inner Rodney Dangerfield, some people get no respect. Which is a back-alley, clunky, comedy club way to introduce you to my Deep Thoughts column. Much like last season, this is where we will plunge into the dark recesses of my mind (fun huh?) and dive deeply into deepest depths that is the mouth of madness we call player analysis.
This first episode features the statcast wonderboy, Mitch Garver (a catcher? GASP!), who has also been underappreciated. Did he benefit from Tropicana-infused balls (not the Rays’ park, the juice cocktail… hmm now that I think about it, did anyone else notice that 2 ballparks are sponsored by juice companies? Manfred!) or did he just flex on the league hidden within a stacked Twins lineup? These questions and more I hope to answer.
To understand how we got here Hayley Williams, asking these questions, we need to look at old Mitch vs new Mitch.
| BB% | K% | AVG | OBP | SLG | BABIP | ISO | |
|---|---|---|---|---|---|---|---|
| 2017 | 13.4% | 22.8% | .291 | .387 | .541 | .347 | .250 |
| 2018 | 8.7% | 21.5% | .268 | .335 | .414 | .330 | .146 |
| 2019 | 11.4% | 24.2% | .273 | .365 | .630 | .277 | .357 |
Now, if we were on Sesame Street singing, “One of these things is not like the other” teaching our children to conform to the mob and be judgy, there’s a season that stands out. Oddly enough, it’s not 2019. His 2018 campaign does, that produced a line of 38/7/45/.268 in 103 games. Otherwise known as, meh. He walked less and hit the ball with less power. The story beneath the story points to his breakout 2017 AAA season and his monster 2019 seems to be closer in-line. Let’s see if the batted ball metrics agree.
| GB% | LD% | FB% | HR/FB% | Pull% | |
|---|---|---|---|---|---|
| 2017 | 38.4% | 25.0% | 36.6% | 20.0% | 46.4% |
| 2018 | 39.8% | 22.5% | 37.7% | 8.0% | 38.8% |
| 2019 | 38.9% | 13.7% | 47.3% | 29.0% | 51.3% |
I’ll just go ahead and get out in front of this one. Last season Garver sold out and hit a ton of fly balls, 47.3% of his contact to be exact. That is, how you say, a lot. he hit a lot of them and also converted 29% of those into HR. That’s easily more than his last 2 years combined. However, here comes the justification, that is more congruent (word of the day) with his AAA numbers than his 2018 numbers. Not only that but his spray charts for said seasons also tend to match, especially with pulled balls line up. This is further evidence that the outlier is more likely his 2018, not 2019. Time to peel back another layer of the onion. Or parfait, for the one donkey reader.
| Barrel% | EV | EV+ | LA | xSLG | wOBA | Hard% | |
|---|---|---|---|---|---|---|---|
| 2018 | 5.6% | 88.8 | — | 12.5 | .402 | .325 | 38.8 |
| 2019 | 15.6% | 91.1 | 97.2 | 15.3 | .573 | .405 | 50.0 |
Hurricane Garver last year was a force of nature: he was top 5% in Barrel%, xSLG, wOBA, and Hardhit% that benefited from a 15.3% average Launch Angle. And his EV+ (on balls in the air) was good for 7th in all of baseball. You can also look back at my 2019 Season Recap and see that he led all of MLB in HR/AB beating out some guy named Mike Trout. Garver hit the ball really hard with good contact. And not just good for a catcher, but really good for anyone in the league. It wasn’t a lot of smoke and mirrors or trashcans either. There looks to be a little luck involved with the 29% HR/FB rate and a 60 pt spread in his SLG and xSLG, but by in large he earned an overwhelming part of it. So how did he do it?
| AVG | AVGdif | SLG | SLGdif | LA | Whiff% | |
|---|---|---|---|---|---|---|
| Fastballs | .341 | +.057 | .838 | +.401 | 18 | 15.8% |
| Breaking | .186 | -.043 | .395 | +.009 | 13 | 34.1% |
| Offspeed | .174 | -.104 | .261 | -.100 | 8 | 37.3% |
Mitch Garver out here living his best life by crushing freaking fastballs. He learned what’s best for him; sit tight and swing free. You can see in the differential columns (comparing 2019 to 2018) that by selling out for fastballs he nearly doubled his SLG on fastballs to an astronomical .838 clip at the cost of 100 pts on offspeed pitches like changeups. Which makes sense seeing that he was whiffing 37% (more than double) compared to 15.8% on fastballs. How can he afford to do this and not get carved up by secondary pitches?
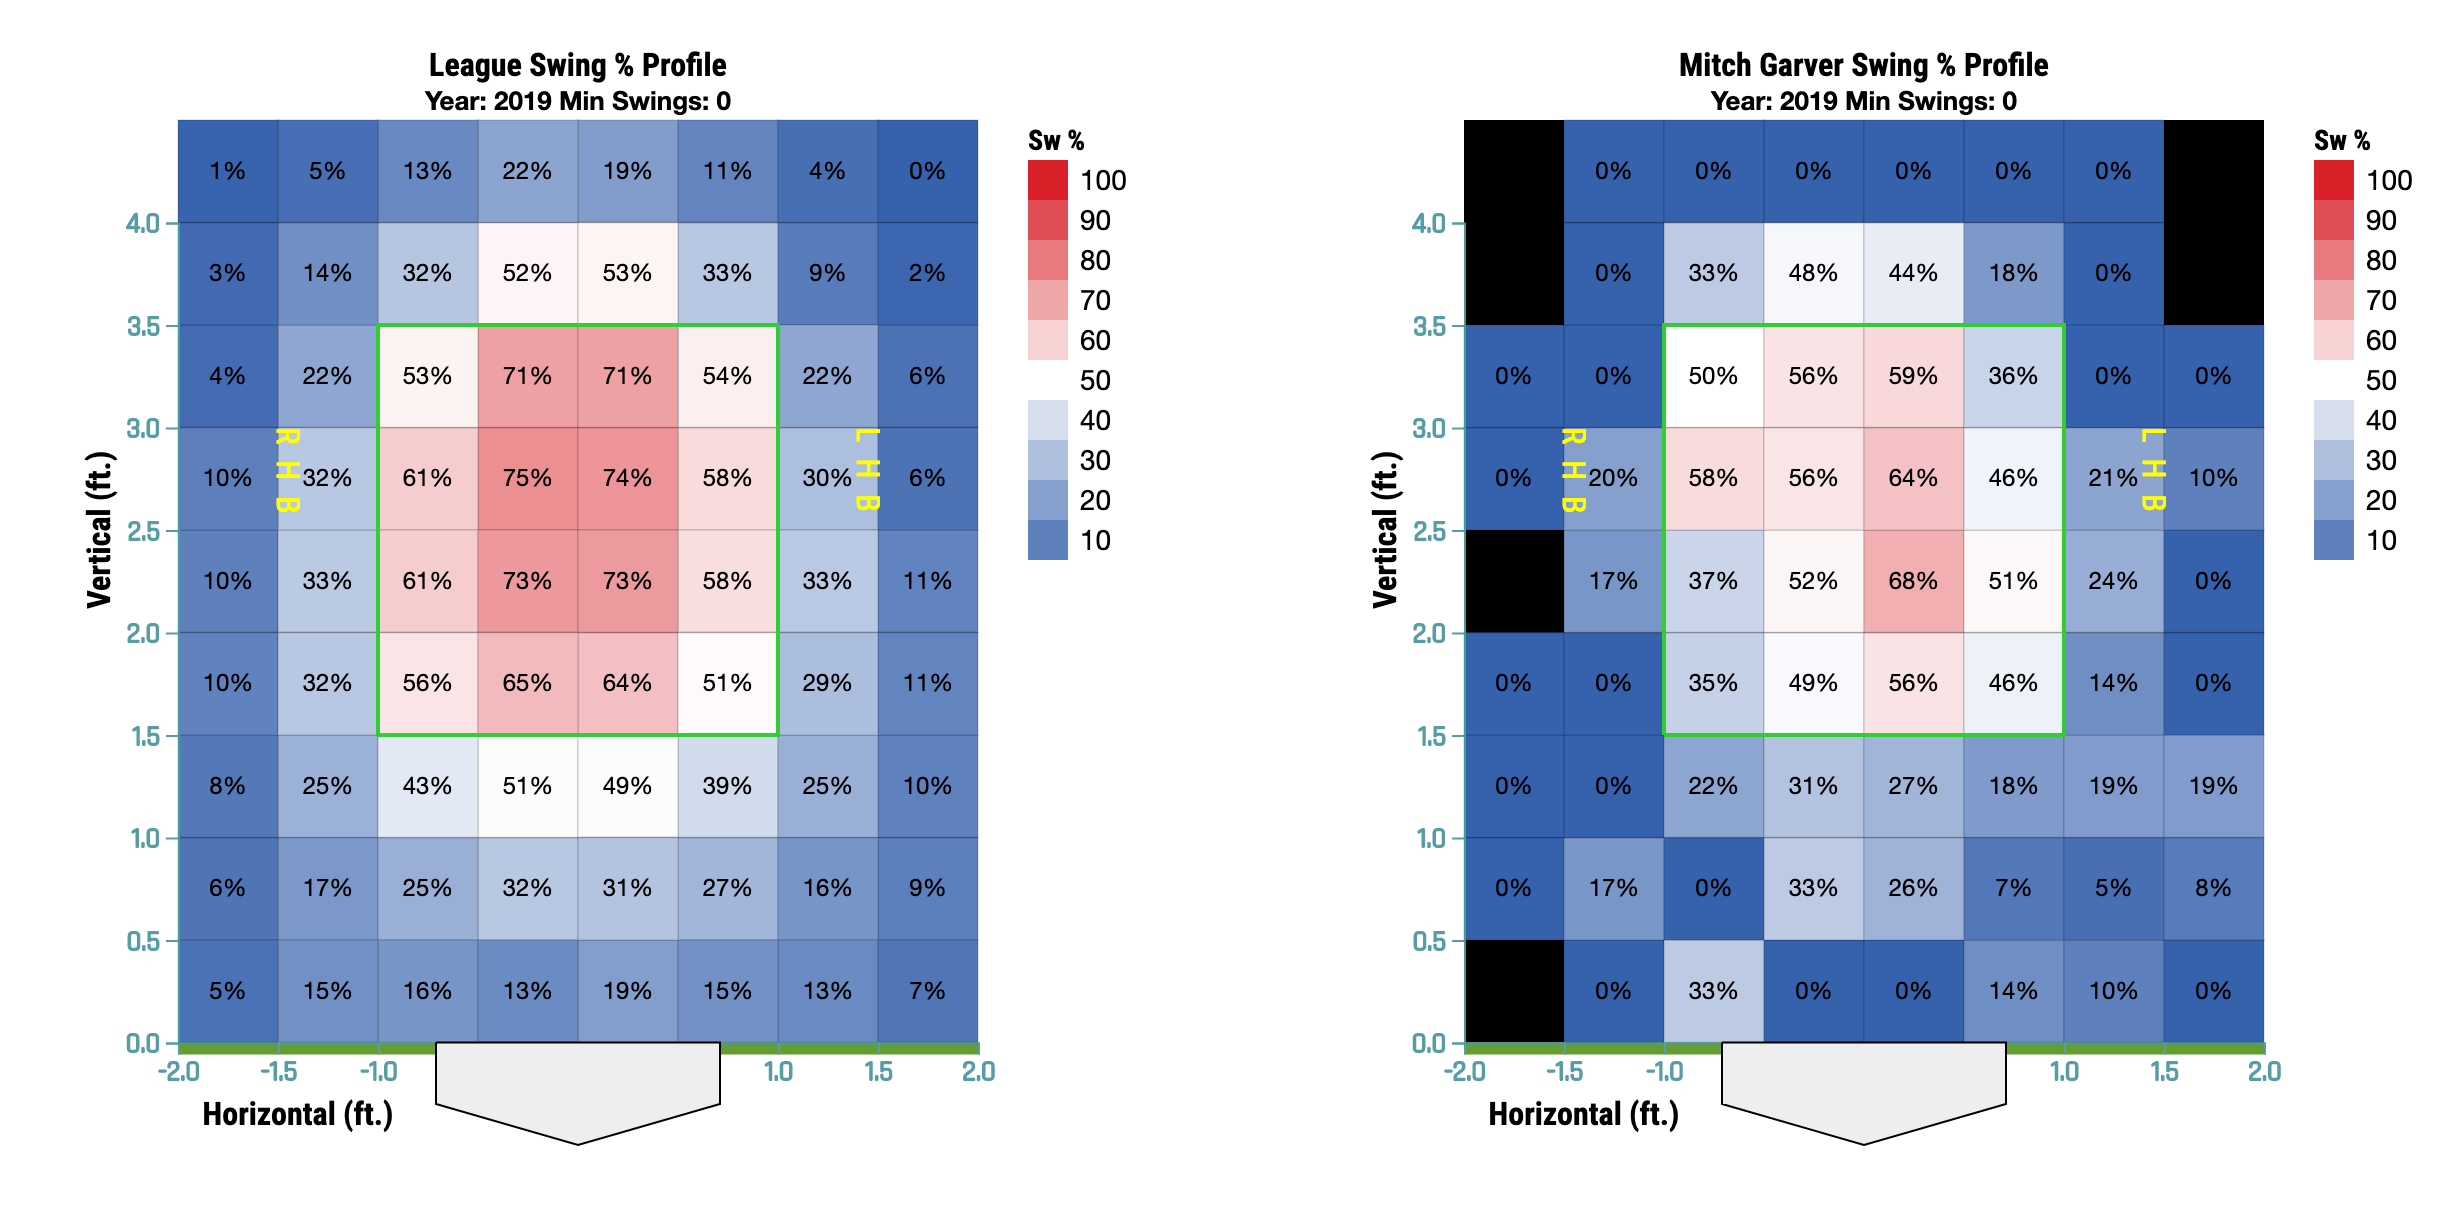
Garver has the plate discipline of a saint. Just look at his swing profile. On the left is the league average, on the right is Garver. He was sitting dead red fastballs in the center of the plate and gave zero flux about any deviation. He had a Swing rate of 34.9%, Chase rate of only 17.4%, Zone Contact rate of 88.0%, and a Swinging Strike rate of 8.1%. You could not get him to chase a damn thing and if you left it in the zone, goodbye. Ain’t that a Mitch?
He was able to capitalize on this because opposing pitchers were far more concerned with the rest of the Twins stacked lineup. Most of the time he was hidden between Rosario and Sano and occasionally bat leadoff vs LHP (1.170 OPS split). Pitchers had to throw him fastballs to avoid setting the table for “bigger” bats behind him, and he made them pay. The lineup got even better this year by adding Donaldson to a lineup that scored the most runs in 2019, leaving Garver the chance to profit yet again.
Most projections on the corona-timeline are saying he’ll get between 17 and 21 HRs in about 100 games (roughly the same ABs from 2019). Even though there’s some regression baked in, that still prorates to 25+ HRs in 460ish normal full-season ABs for a catcher. And with some of those flyballs dropping balanced by a rebounding BABIP to his career-norm close to .300 he’s still going to hit around .260 with a good OBP accompanied by plenty of counting stats. That is one tasty dish so you can pass on the soup de’jour Realmuto. The wasted pick under 100 will drive you batty. Stay safe out there. #QuarantineAndChill