

Last season, we looked at The Umpconscious Bias, tendencies that we can observe for umpires using ball-strike data for every pitch they call. The four tendencies we found were;
- Bias #1: Lefties Get the Benefit of the Doubt
- Bias #2: Zone Opens Up Late in Games
- Non-Bias: Home Team vs Road Team
- Bias #3: Solidarity Among Generations
- Bias #4: So Who Do They Hate? (plus the He Hate Us Teams)
After publishing that article in September, I kept thinking in the back of my head about Bias #1, where umpires were way worse at calling borderline calls against right handed batters compared to left handed batters. Some umpires were as extreme as Hunter Wendelstedt, who was calling 38% of borderline balls as strikes vs righties and only 7% of borderline balls as strikes vs lefties, which is an extreme shift in accuracy.
The platoon mystery solved
The answer was actually right in front of my face, flashing back to a section from the original article:
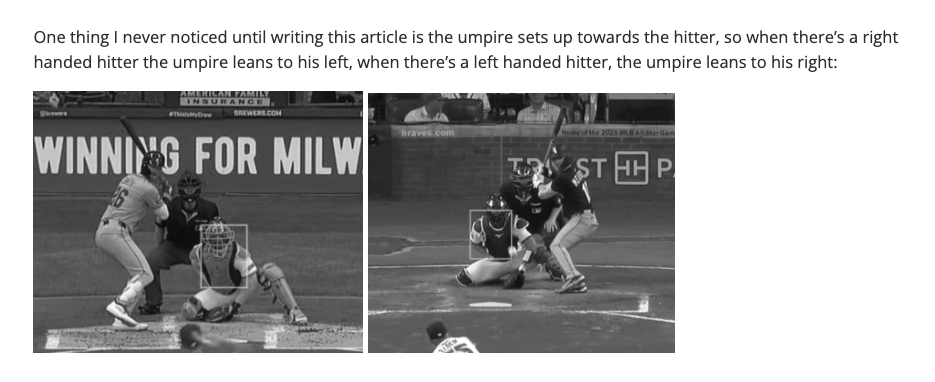
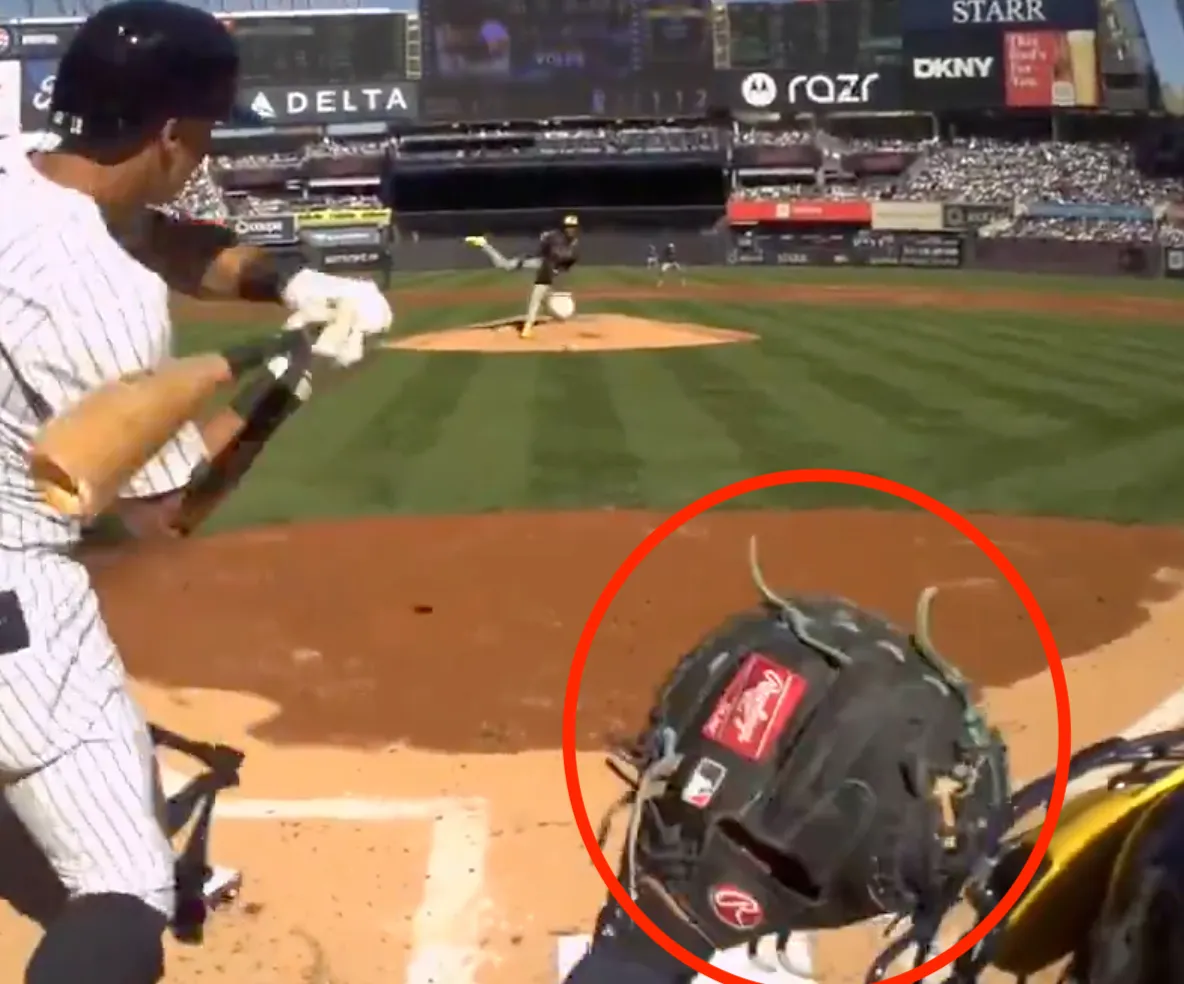
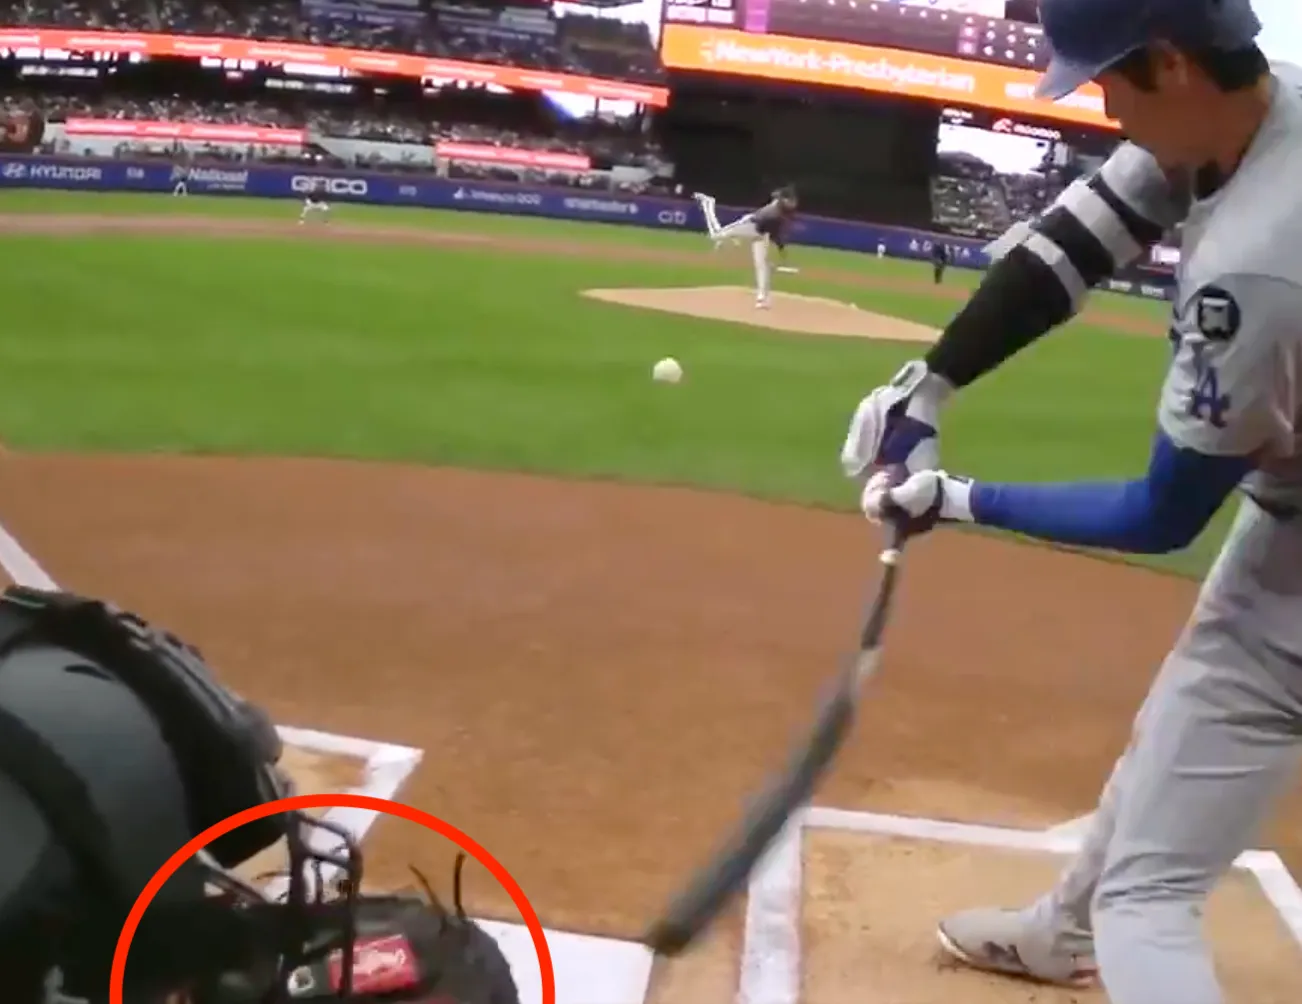
When an umpire is standing in this lane and looking between the catcher and hitter, you would assume that they have the same view of the pitch coming in from both sides, but they actually do not, and that’s because of the man directly in front of the umpire, the catcher. Every single catcher since 1990 has been right handed, which means as the pitch is coming in, the catcher is always lifting their left hand to receive the pitch. This means an umpire is actually getting a much less obscured view of the plate when a pitch is received when a left handed batter is hitting vs a right handed batter:
Enter the robotic interference
ABS challenges arrived this season, and just to review the mechanics for someone who somehow haven’t watched a second of baseball this season; After a pitch is called ball or strike, a hitter, pitcher, or catcher can taps their helmet (immediately, no conferring with the dugout), and the The stadium screen draws a little box and drops a ball in it and everybody finds out at the same time if the call was correct or incorrect:
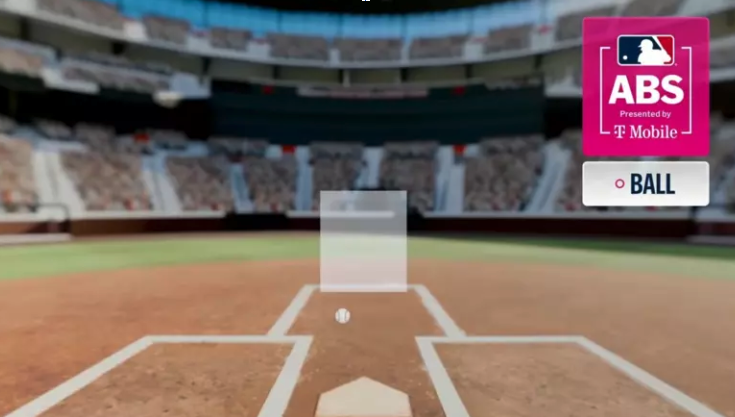
Each team gets two challenges per game, or more accurately, two *incorrect* challenges per game. As long as they keep getting calls overturned, there is no limit to how many times a team can challenge (the most challenges in a single game was ten by the Brewers against A’s on June 8th).
It’s become obscenely clear, less than one full season into the ABS era, what a helpless state a team being out of challenges becomes. Broadcasters have picked up on this as well, and there is always the courtesy reminder to the audience when a bad call is made against a team out of challenges; “here’s the pitch… a strike on a ball outside and remember folks the Reindeers are out of challenges in this game”.
So does it matter? Do more calls actually go against a team once they have no way to defend themselves?
I pulled every taken pitch in the shadow zone this season, the ring of pitches straddling the edge of the strike zone where a call could plausibly go either way. That is 91,034 pitches across 1,627 games. For every one of them, I know which team the call went against, and exactly how many challenges that team had left at that moment.
| Challenges left | Calls that stand against you |
|---|---|
| Both | 13.0% |
| One | 13.4% |
| None | 17.8% |
A team with both challenges in its pocket eats a bad call on 13 of every 100 borderline takes. A team with nothing left eats 17.8. That is a 37% jump, and it switches on the moment a team is out of challenges.
Teams Are Punished On Both Sides
A call going against you means two different things depending on which half of the inning you are in. At the plate, it is a pitch off the black rung up as strike three. On the mound, it is a pitch you painted on the corner waved off as ball four. Opposite directions, same borderline ring, and here is the part that gets forgotten: your two challenges cover both of them. Your left fielder getting punched out on a bad one in the fourth is the reason your closer has no recourse in the ninth.
Split the damage by which kind of call it was:
| Both challenges | None left | Damage | |
|---|---|---|---|
| Called strikes against your hitters | 13.3% | 17.8% | +4.5pp |
| Called balls against your pitchers | 12.7% | 17.8% | +5.1pp |
Almost identical. It does not matter whether you are holding the bat or throwing the ball. Run out of challenges and about five more calls per hundred stick to you, in both directions at once. The offense and the pitching staff are sharing one fuse, and when it burns out everybody gets it.
The Umpconscious Non-Bias: The Helpless Team
So we’ve caught the umpires. Helpless teams are getting unfairly punished by vindictive umpires- wait, why does that header say “Non-Bias”?
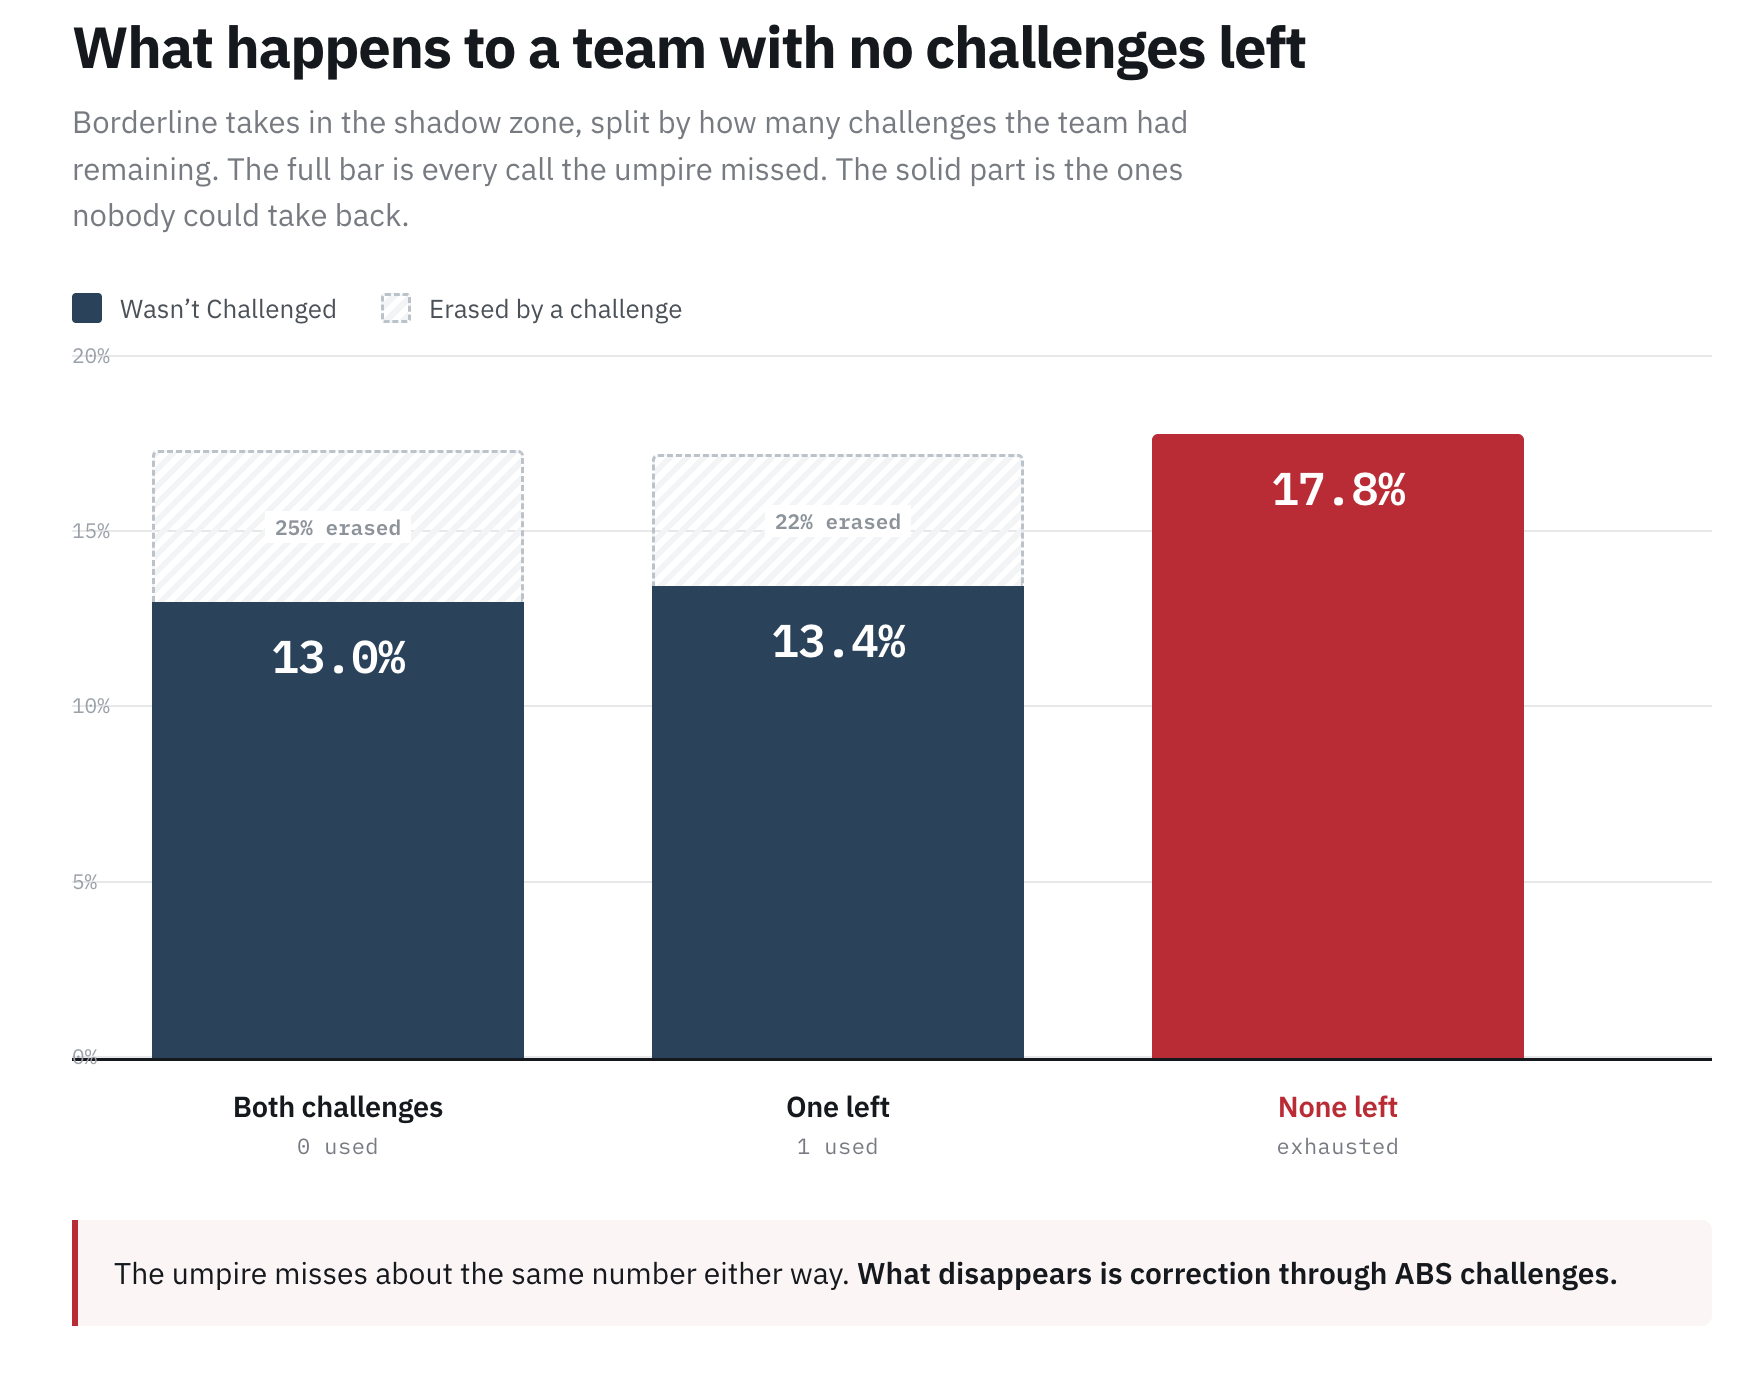
To learn why, I look at what the umpires are actually doing before any challenge gets applied. Across the three states (2 challenges remaining, 1 challenge remaining, challenges exhausted), the miss rate is actually 17.3%, 17.2%, and 18.1%, a flat line. They are blowing the same number of calls whether you can fight back or not.
So where do the extra calls come from?
| Challenges left | Share of blown calls wiped off the board |
|---|---|
| Both | 25.0% |
| One | 21.8% |
| None | 0.0% |
There it is. A quarter of the mistakes against you simply stop existing while you have a challenge in your pocket. Somebody taps the helmet, the box appears on the video board, and the bad call is wiped off the board.
The issue was not that bad calls increase when you run out of challenges, but more that there is no one to undo them (the other team isn’t going to help you out with their challenges):
The Most (ABS) Helpless Team
While there isn’t an umpire bringing your team down, the teams are certainly doing it to themselves, and no one does it more than the White Sox. Chicago (AL) has exhausted their challenges in 50 of their 107 games, 46.7%, against a league average around 27%. Their typical wipeout lands in the eighth inning, so in nearly half their games Chicago plays the last two innings eating whatever the zone is called by the umpire.
What I like is that there are two completely separate roads to helplessness, and the White Sox drive both. Minnesota is the pure volume case; Nobody taps the helmet more than the Twins at 2.77 times a game, and they are good at it, winning 55.3% of the time. They only run out because they never stop asking. Meanwhile, Pittsburgh is the mirror image, the least accurate challengers in baseball at 43.1%, and they are not even aggressive about it. They run out because they are wrong.
The White Sox do both, challenge often and challenge incorrectly
| Team | Challenges/game | Win rate | Failures/game | Games out of challenges |
|---|---|---|---|---|
| White Sox | 2.47 | 46.2% | 1.33 | 46.7% |
| Twins | 2.77 | 55.3% | 1.24 | 41.3% |
| Pirates | 1.98 | 43.1% | 1.13 | 37.6% |
| League average | 2.11 | 53.3% | 0.99 | 27% |
