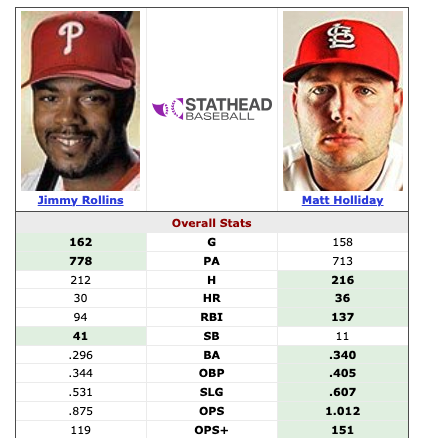
Think about a close MVP race from the last 20 years. I’m gonna go with 2007, because that was the first year I played fantasy baseball, which meant it was also the first year I followed baseball stats closely. The National League MVP debate that came down to Matt Holliday and Jimmy Rollins. Matt Holliday was coming off a monster offensive season, slashing .340/405/.607 with the Rockies while hitting 34 HR and a league leading 137 RBIs for a Rockies team that made the postseason after taking down the Padres in a Game 163 (no comment on homeplate touching). Jimmy Rollins, meanwhile, played all 162 games for the NL East winning Phillies, joining the “four 20 club” (not the 420 club, which I’m in), hitting +20 homers, +20 doubles, +20 triples, and stole +20 bases. It’s actually even more impressive because he hit 30 homers, 38 doubles, 20 triples, and stole 48 bases, so it was a 30/30/20/40 season, which Rollins 2007 is the only one on record. Ultimately, Jimmy Rollins nabbed 16 of the 30 first place votes (Holliday received 11) and became the fourth Phillies player ever to win MVP, and interestingly, we have not seen a shortstop win MVP since.
This article isn’t a history lesson, though. The thing to focus on is the *thought process* that went into deciding who deserved to be MVP between the two. Remember that this was 2007; pre-iPhone, emo music was the rage, Fangraphs wasn’t really a known website, Razzball literally didn’t exist, and most importantly, WAR was not part of the common baseball vernacular. People would look at stat leaders in each category, and use their big brain to think “well… Rollins hit 30 homers and Holliday hit 34 HR… but Rollins is a shortstop so I will give him some magic beans… but Holliday lead the league with a .340 average… but he does hit in Coors, so I will deduct magic beans in my brain” then decide who “deserved” an award based on an on-the-spot calculation that was almost entirely vibes based, and if pressed on it, likely couldn’t even write it out on paper. While the vibes based system made for endless debates at bars across the country, ultimately, nerds were able to calculate how many magic beans to add for being a shortstop, and how many magic beans to take away for a guy who mashes in Colorado.
Much has changed since 2007, everyone has iPhones, emo music is dead (but never gone), Fangraphs and Razzball are stalwarts in the online baseball world, and WAR is basically what dictates the MVP voting. Many of the debates that used to occur in past years have been settled even before the season ends, because WAR shows us who should be the finalists, and if there will even be any suspense to who is going to win the award. It’s the keystone baseball statistic, a way to compare players from different positions, different home ballparks, even from different eras.WAR is cited not just for award voting, it controls the conversation about trades, free agent signings, and ultimately who goes into the Hall of Fame.
With such a profound impact and control over the entire baseball world, one would assume the average baseball fan would have a pretty detailed feel of how their favorite player’s WAR is made up. Nothing like sitting around with the boys and saying “I think Bobby Witt has been okay for the Royals since he’s leading the team with a 1.1 WAR, *although*, 0.6 of that is from his fielding”. No one talks like that, and it’s safe to assume you, reading this, are not aware that most of Shohei Ohtani’s NL leading 1.5 WAR is comprised of mostly pitching WAR or hitting WAR. The opaque nature of WAR’s calculation often feeds skepticism about its value as a metric. People will say, “I don’t care what WAR says, which no one knows how it’s even calculated, blah blah blah.” The thing is, this is not true! At least for Fangraphs WAR calculation, the components are listed under the player’s “Value” table and shown as Run components.
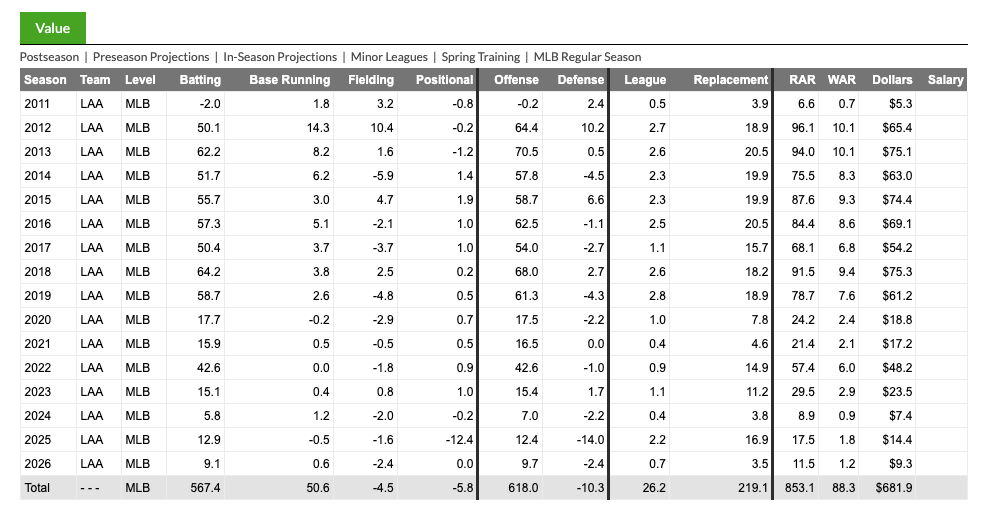
This table is insane if you could read runs added
The reason this table is useless to most people is that it shows the WAR components as “Runs” which then needs to be converted to “Wins” (usually it’s around ~10 runs per win). Once you convert the components, you can see that WAR is simply the total of the component value you get from:
- Replacement = This is simply the value you bring from playing
- League = Additional value you bring from the league you are in
- Positional = Value you add (or lose) based on the position you play
- Base Running = Value from being a good/bad baserunner
- This is not just steals but taking extra bases on singles, scoring from first on a double, all the hustle stuff
- Fielding = This used to be based on Defensive Runs Saved, but not based on Statcast’s Outs Above Average
- Batting = This is the normal batting stuff you see, adjusted for ballpark and hitting environment
Taking these components and graphing them creates this:
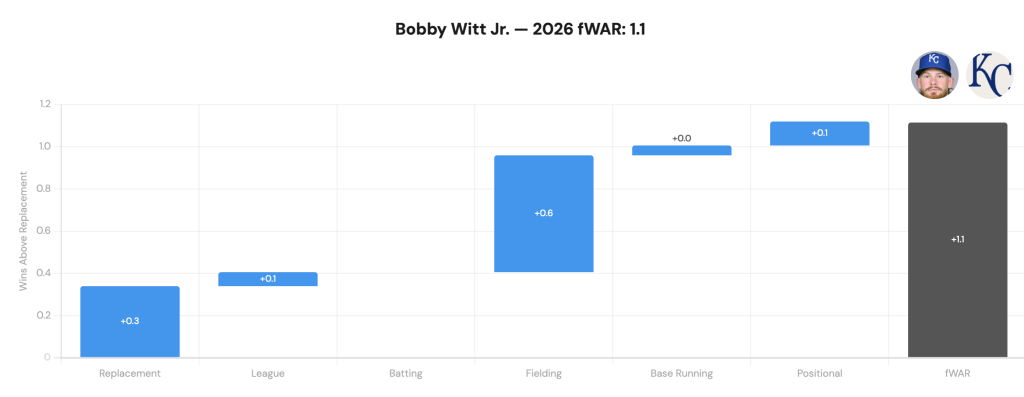
This graph is from the WAR component breakdown tool I’ve created. It will let you pull – for any player and season since 2002 – a breakdown of the player WAR by each component. In this example for Bobby Witt Jr, he’s basically been a replacement level player hitting-wise, and all his value is coming from fielding (he has been a great fielder), some from base running, and some from positional (as in just being a shortstop). You might see this graph and think, “Wait, he gets a third of a win from just playing? Does that mean you need to be *worse* than replacement to have negative WAR?” and the answer is yes. To show this, check out Luisangel Acuna’s breakdown:
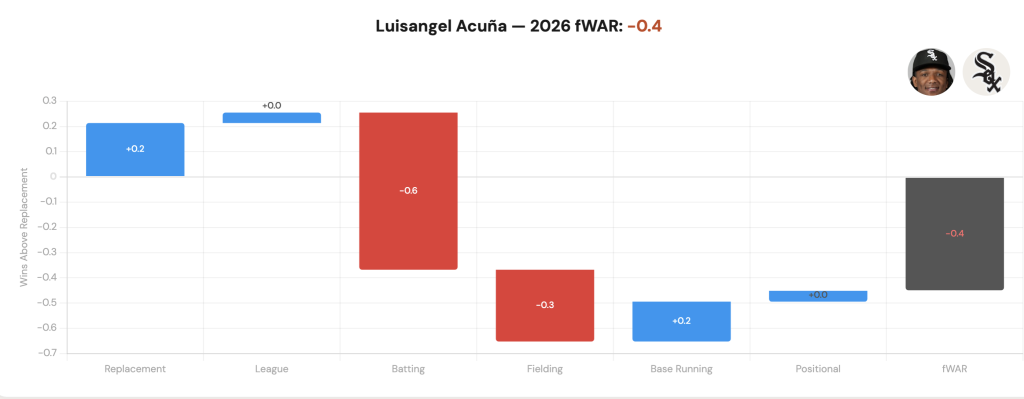
He gets a fifth of a WAR just for playing, but then loses all of it and more from having a .422 OPS, then loses even more for being a poor fielder (although he is playing centefield which he did not play in the minors), and then gets some back from being a good base runner and playing a “premium” position (centerfield) for a total of -0.4 WAR. The goal of this is to demystify the all-important WAR number by understanding exactly how it adds up to the total.
Naturally, once I had the breakdown tool setup, my next thought was, can I pull this for every player at once and show a leaderboard, and that’s what you can find in the leaderboard tab. Here is the breakdown of the current Top 15 players by position player WAR:
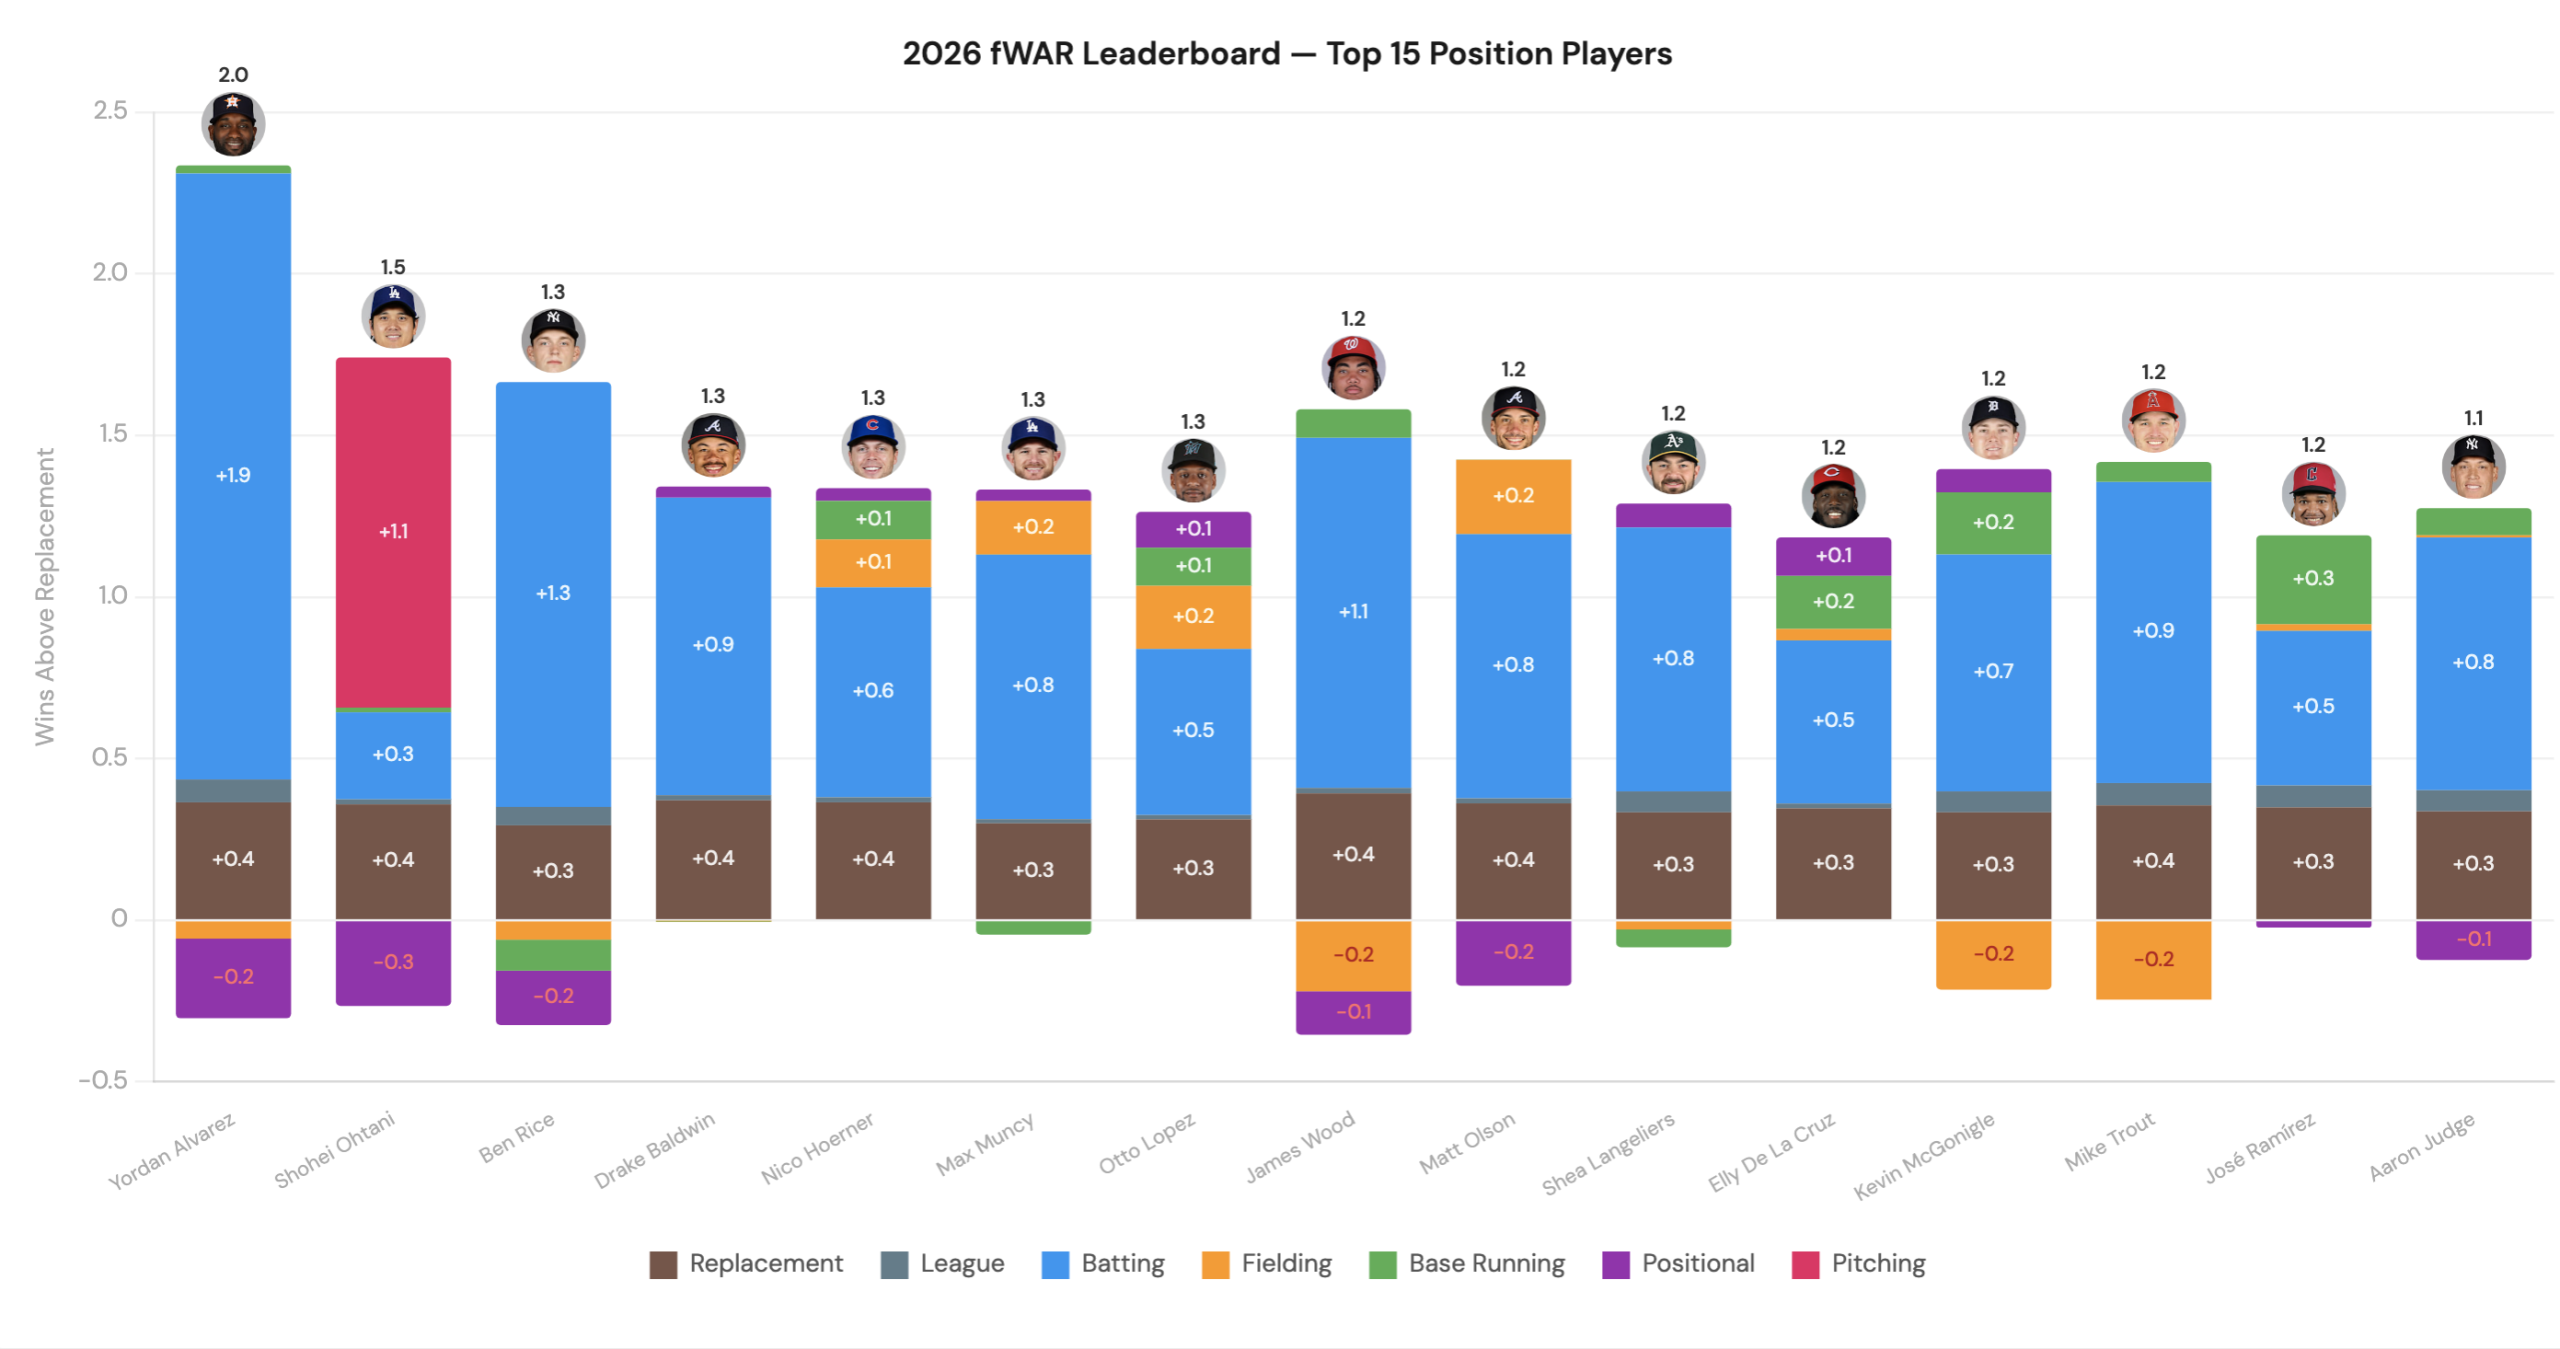
The legend on the bottom shows you how the value adds up for each player, but notice this is not like a regular stacked bar chart, where the highest “bars” represent the highest numbers. James Wood is in the middle of the chart, even though his bar is about as high as Ben Rice, who is in third, and that’s because Wood has those negative numbers on the bottom of his bar. He loses -0.2 WAR for being a below replacement fielder, and an additional -0.1 WAR from being a left fielder. Similarly, Yordan and Ohtani both lose positional WAR from being a full time DH. Nico Hoerner is #5 in baseball even though his blue bar for batting is much smaller than those around him, and that’s because he’s basically getting positive value from all angles, by not just hitting well but being a good fielder, base runner, and playing a premium position.
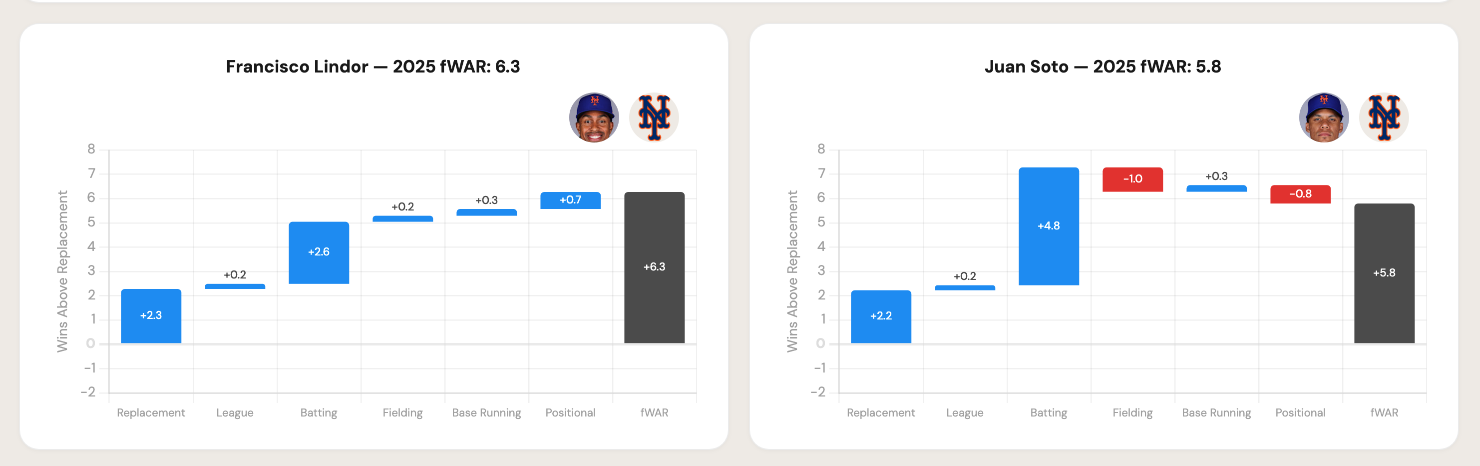
The third “Compare” tab in the tool lets you put this breakdown side by side. Here’s a comparison of two teammates last season, Juan Soto and Francisco Lindor, where Lindor had a higher WAR even though Soto had a .878 OPS and Lindor had a .811 OPS:
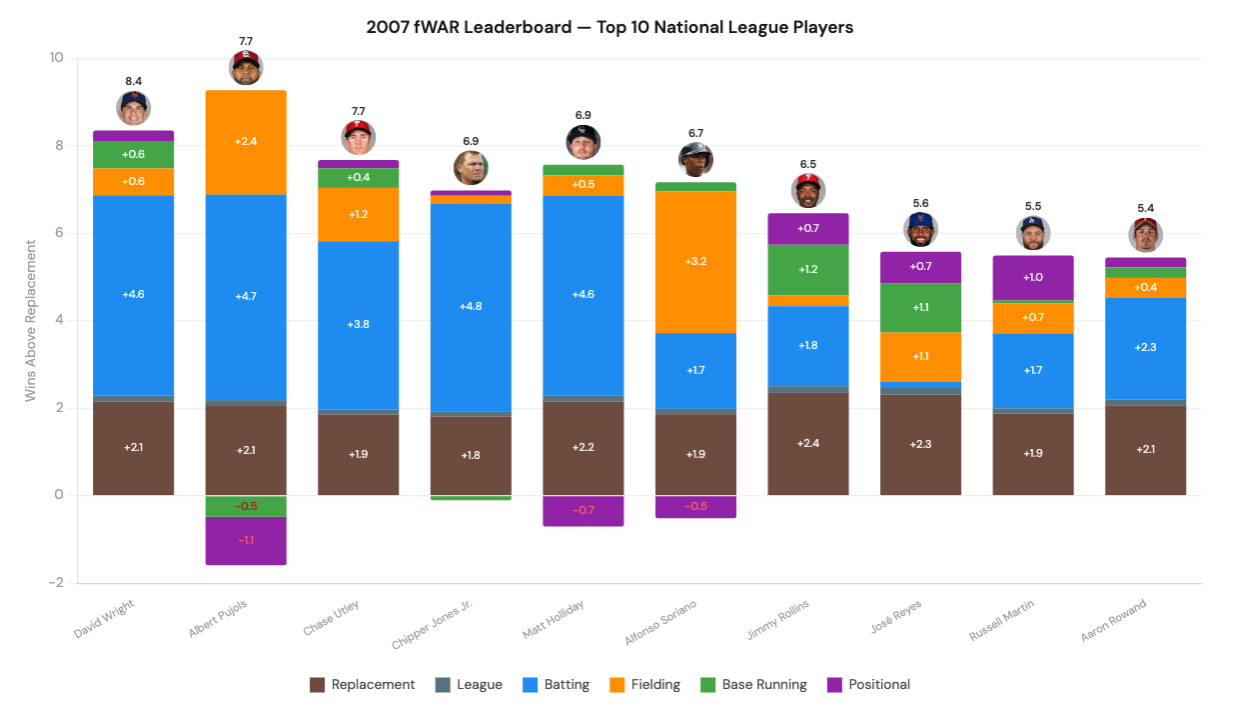
This brings us back to the 2007 NL MVP debate. Instead of counting mental magic beans like we did back then, we can see an accurate accounting of the value they brought:
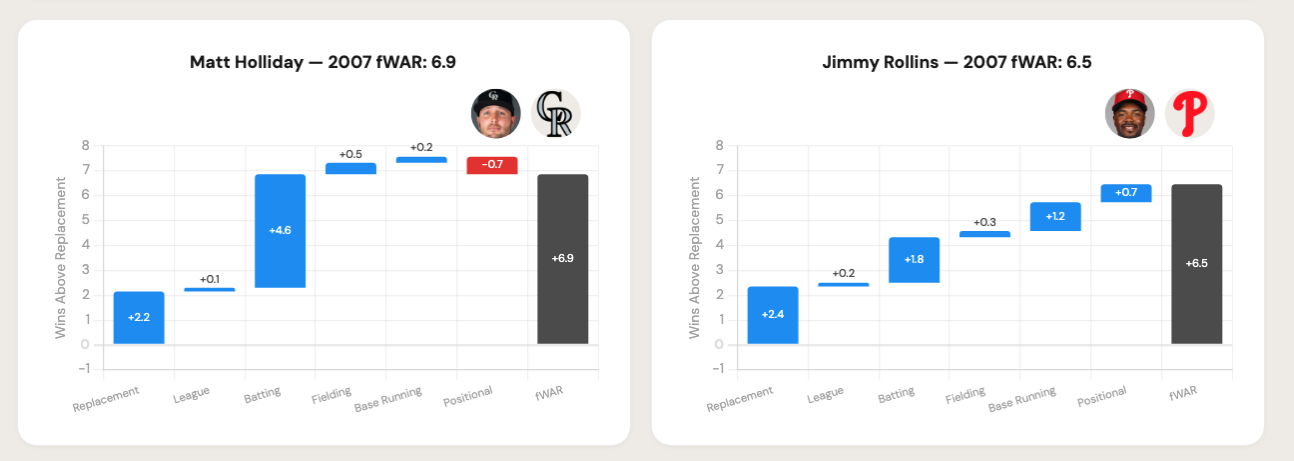
It turns out even with the discounting of his offense at Coors, and the premium of Rollins playing shortstop, Holliday still leads Rollins slightly in total WAR. So did the voters almost get this right? No! Just look at how much both were behind others on the NL WAR leaders!