I was never particularly motivated to use VLOOKUP (or any other function in Excel) for “professional” working purposes. I learned it a few years ago strictly to become better at fantasy baseball. By taking all of the public information that is available at your disposal, and combining fantasy valuations and projections from various industry resources (using mostly VLOOKUPs – seriously, it’s the only thing that I know how to do), you can formulate composite projections which paint an accurate picture of the fantasy landscape, and eliminate limit your individual bias when you inevitably use those projections and re-rank players by position. One resource that I find particularly helpful, and which you might not already incorporate into your own process, are the player propositions and betting over/under totals provided by sportsbooks. The betting market sets extremely reasonable expectations with regards to player floors and league leaders in statistical categories and can provide guidance as to where your projections stand relative to public perception both on an individual player basis, and against the league as a whole. The fact that a player is listed in a category, in and of itself, can be extremely telling as to their raw skills and expectations for the upcoming season.
I found 102 batters listed across four stat categories, but only six batters were listed in all four counting categories. There are clear ranges in each category: Runs (85.5 – 117.5); Home Runs (17.5 – 39.5); RBI (85.5 – 116.5); and Steals (20.5 – 44.5).
Narrowing Down the Counting Category Stars

So, the only players with props listed in all categories were four of the top six leaders for the 2018 AL MVP award, the 2018 NL Rookie of the Year…and Trevor Story. As you can see, the projections and betting totals align very closely.
With the cutoff for the steals prop at 20.5, reigning NL MVP leaders Christian Yelich (16 projected steals) and Javier Baez (17) likely just missed the cut for being listed, and I wouldn’t expect a 30-20 repeat from either. For what it’s worth, there is some discrepancy in their power perception; Baez is projected for 31 homers (Vegas says 27.5), and Yelich is projected for 27 (Vegas says 29.5).
Sportsbooks likely project Francisco Lindor to return sooner than the public expects him to, as the composite projections fade all of his over/under totals, but I’m personally ignoring all of those “don’t draft Lindor” and “Lindor is the infielder to avoid” articles currently floating around. I have yet to own Francisco in fantasy baseball, but I’ll gladly take him at a discount going into 2019 as his injury timetable moves closer to opening day.
Trevor Story is the real talking point here – if you have been avoiding him in the second round because you simply, “don’t think he’s good enough,” please stop doing so (unless you are in my leagues, then please continue to do so). Story’s inclusion in every prop category, alongside THIS peer group, should tell you everything that you need to know about his fantasy value.
The concerns? Story’s projected average (.267) pushes him a half of a round behind Lindor and a full round behind Ronald Acuna, and he missed a week with an elbow issue in September; leaving some lingering health concerns heading into 2019.
Trevor Story showed real growth at the plate last season, cutting his strikeout rate by 9% despite swinging 2% more often, and he started to flash his game speed – converting 27 of 33 steal attempts (81%) after swiping 97 of 110 bases (88%) in the minors. He also ranks 7th amongst shortstops in defensive runs saved (+16) over the past three seasons, leaving little concern that he would be displaced, defensively, by a surging Brendan Rogers.
Counting Stat Buckets
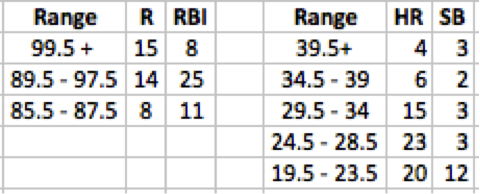
In the same way that player projections and betting totals show statistical overlap, so too does the frequency of players that pop up within certain statistical ranges or buckets. Here is a breakdown of the number of batters projected to fall within specific counting stat buckets, based upon the betting lines:

For comparison’s sake, the composite projection accounts for 22 players (Vegas projects 23) who will reach 20+ steals, while accounting for 26 players (Vegas projects 25) who will surpass the 30 home run threshold. If you have substantially additional or fewer players in those range groupings or buckets, you might want to rework your batter projections.
Per Vegas, 19 players have expected run and RBI totals greater than or equal to 89.5. The composite projection only accounts for 14 players but includes all 19 if you lower the projection filter to 87. Here are those 19 hitters likely to be a big plus in BOTH runs and RBI: Ronald Acuna, Nolan Arenado, Javier Baez, Mookie Betts, Alex Bregman, Khris Davis, Freddie Freeman, Joey Gallo, Paul Goldschmidt, Bryce Harper, Rhys Hoskins, Aaron Judge, J.D. Martinez, Jose Ramirez, Anthony Rizzo, Juan Soto, Giancarlo Stanton, Mike Trout, and Christian Yelich. Note that Lindor and Story barely missed this list based upon their totals listed above.
Putting Pitchers into Buckets
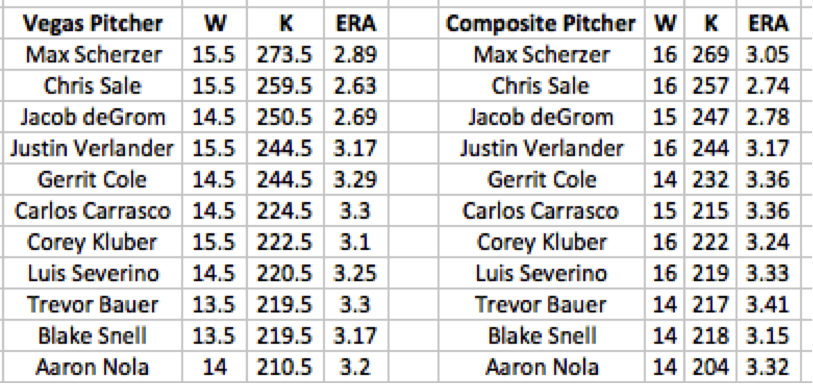
40 Starting Pitchers are listed across three pitcher categories with defined ranges: Wins (9.5 – 15.5); Strikeouts (182.5 – 273.5) and Earned Run Average (2.63 – 3.75). Only 22 starters had totals posted in all three categories, and of those, only 11 met the following criteria by betting totals: 13.5 wins or more, 200 strikeouts or more, and an ERA of 3.30 or below. Here is how that group of “Aces” compares to their composite projections:

The only potential surprise in the group is Trevor Bauer, who rode an 80% strand rate and a 6% HR/FB rate to a 2.21 ERA in 2018. Vegas and projections expect him to split his ERA last year with those from previous seasons (4.19 in 2017, 4.26 in 2016), but his presence on this list of star pitchers confirms that the breakout was legitimate.
Also, the projections and totals are again pretty consistent here. The biggest discrepancies are in Severino’s wins (+1.5 in Projections – tied with the league leaders at 16), Cole’s strikeouts (-12.5 in projections) and Scherzer’s ERA (+0.16 in projections).
Let’s see how the starting pitcher group breaks into buckets, based upon the betting lines:

As with the hitter groupings, the number of players in each bucket is not meant to be exact. It is meant to serve as a guideline to prevent you from, for example, accidentally doubling the number of starters you project to strike out 200 hitters.
In fact, 15 starters are projected by Vegas to strike out 200+ hitters, while 14 show up in the projections, and 18 achieved the feat last season. 11 starters carried an ERA below 3.00 last season, but just 21 carried an ERA below 3.4 – more consistent with the 17 as projected by Vegas, and 16 in the composite projections.
Upshot
The betting market, like the fantasy market, is influenced by public perception. It can be a valuable data resource in fantasy baseball, especially when everyone else is looking at the same fantasy driven data and information. I find it to be extremely helpful to eliminate personal bias, to project individual players, and for determining the expected quantity of players who will fall into certain statistical ranges or buckets.
If you happen to be a gambler in addition to being a fantasy gamer, you can easily reverse engineer the process and use composite projections to decide where there might be value in the betting markets.


