
The great Jeff Zimmerman (Fangraphs, The Process, etc.) recently revisited a topic that’s always ripe for debate: what kind of extra value does a multi-position player get, compared to those who only play one position? We can all agree that multi-position is better than single; quantifying that value, however, proves more difficult. A few years ago, Rudy assessed this briefly in his seminal piece, “Debunking Positional Scarcity“, and recommends adding a $1 for multi-position players.
Jeff’s article took a different approach: instead of measuring what a player’s value should be, he attempted to measure the actual impact in terms of draft cost. In other words, what premium does the market place on these players? Read the full piece; Jeff estimates ~$3.20 bump on average.
While I like the goal (understanding market premiums), Jeff’s methodology (comparing the draft cost of two similarly-projected players) was limited in scope. So I’ve set out to do additional analysis with the same goal: measuring the market premium of multi-position players.
Methodology
A quick summary of my approach:
- 3 years’ worth of projected $ value and NFBC ADP
- Mapped my $ values to the ADP (i.e. if my top-valued player was $43, the NFBC #1 ADP gets $43, regardless of the player name; same throughout the pool)
- This approach removes bias that exists based on my custom $ values
- Only analyzing players with an ADP <300
- Positional eligibility based on 20 games the previous year
I then measured the difference between projected value and ADP value for different pools of players. With 529 unique hitter seasons, I hope this methodology provides a comprehensive look at the average cost of various groupings.
Premium Throughout the Draft
The first question I asked: what is the market premium at various points throughout the draft? This is Charting the Future, so it’s time for a chart:
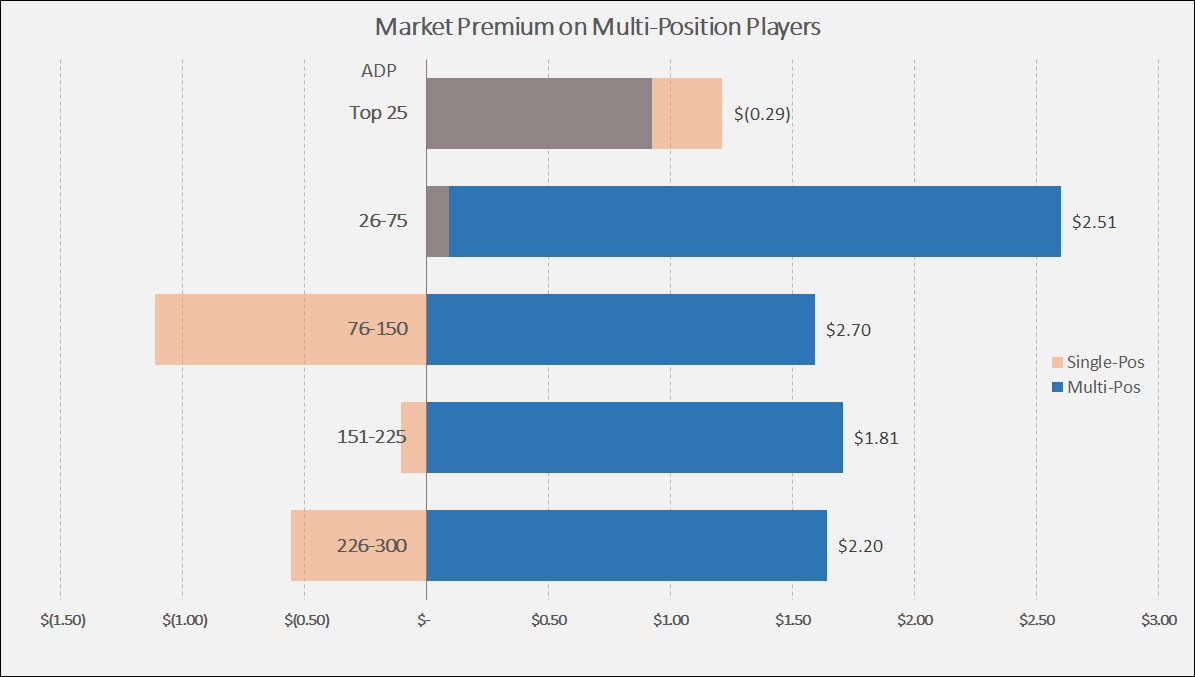
Each bar measures the average premium (+) or discount (-) placed on single- and multi-position players, measured as the difference between the projected $ value and the actual ADP $ value. In addition to the raw average (blue & orange bars), I’ve labeled the net difference between the two. Let’s walk through the results.
Top 25
No premium exists. Multi players are going on average for an extra $0.92 compared to projections, but single-pos players have a $1.21 premium. Basically: you have to pay a little above “market” for top players, which we all know. There’s no extra premium in the first couple of rounds.
Picks 26-75 (roughly, rounds 3-6)
Single-pos players are landing pretty close to neutral value (+$0.09), but multi players get a huge $2.60 bump, netting to a $2.51 premium. This year, that means Ketel Marte, Manny Machado, Kris Bryant, Gleyber Torres, Whit Merrifield, and Jonathan Villar may cost a couple of bucks more than projections alone would indicate.
Picks 76-150 (rounds 7-12)
To balance out the numbers, there has to be some discounts, and this is where we start to see it. Single-position players are going for more than a dollar discount, while multi’s are still getting a hefty $1.60 bump. Net, the $2.70 premium is the biggest gap in the study. Expect to pay up for D.J. LeMahieu, Max Muncy, Jeff McNeil, Mike Moustakas, Eduardo Escobar, and Tommy Edman.
Picks 151-225 (rounds 13-19)
Net, we see a $1.81 premium for multi players; that means you should plan to spend a little extra if you like Yuli Gurriel, Brian Anderson, Ryan McMahon, Hunter Dozier, Scott Kingery, or J.D. Davis.
Picks 226-300 (rounds 20-25)
Another $2.20 net premium; this pool includes Howie Kendrick, Jose Peraza, Starlin Castro, Luis Arraez, and Yandy Diaz.
Once you get past the first couple of rounds, there’s a pretty consistent premium of $2.00-2.50. I’d put that as the maximum, a little below what Jeff Z estimated but not far off.
Positional Impact?
Another key question came up while doing this research: does the type of multi-position eligibility make a difference? Nobody should be bumping up catchers who also have 1B eligibility, because they’re always going to be played at C. In addition, I would expect to see players who add a different positional group (i.e. a 2B who adds CI eligibility) to be more highly valued than those that add another position within the same group (2B + SS).
Sounds like we need another chart:
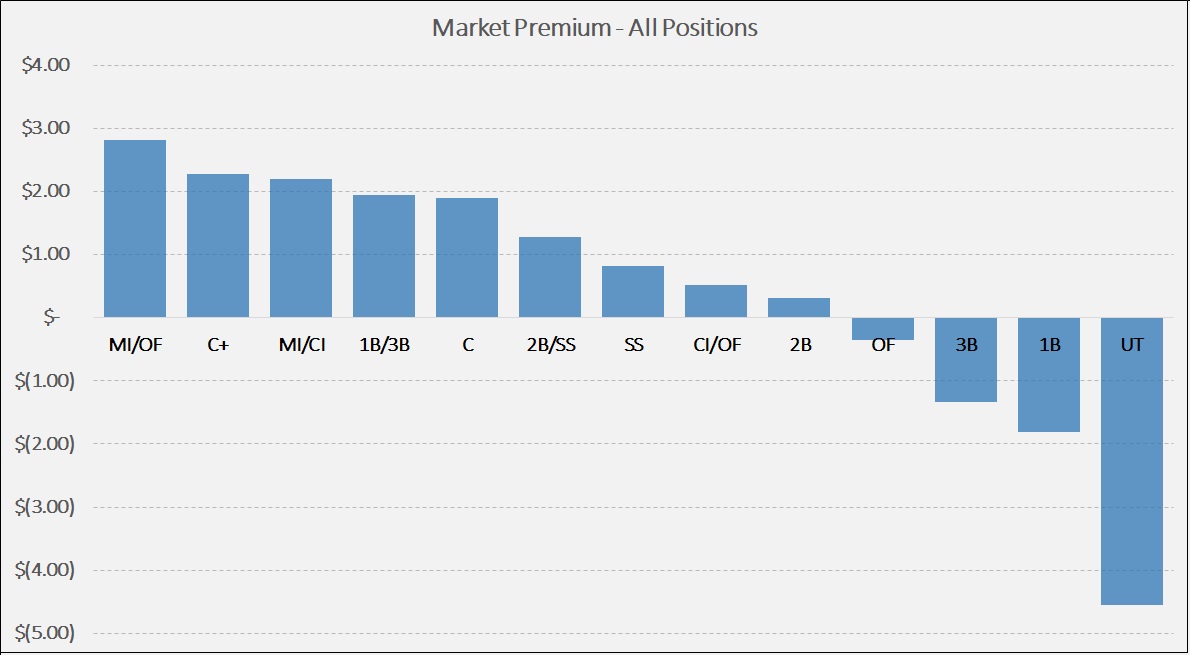
Same data set, but here, instead of averaging based on ADP, we’re teasing apart the average premium or discount based on which positions, including multi’s, the player sets have. Some notes:
- MI + OF or CI take up two of the top three spots, with premiums of $2.82 and $2.20 respectively. You can see the market behaves rationally here, as 2B/SS (MI-only) has a much-lower premium of $1.27. In the top-100, this includes Ketel Marte, Manny Machado, D.J. LeMahieu, Max Muncy, Whit Merrifield, Jeff McNeil, and Mike Moustakas.
- All catchers get a premium; only $0.39 for another position, which I personally think is too high.
- For some reason, 1B/3B has been priced higher than CI/OF. It’s possibly due to depth – everyone always thinks they can grab a sleeper late at OF. But 3B- or 1B-only players have significant discounts, so I’m not sure what’s going on.
- UT-only players have gone at huge discounts. Finding a $4.55 bargain in the draft is really tough, and absolutely worth tying up the UT slot.
Takeaways
- Correct valuation of multi-category players can be looked at another day
- You still need to understand what it will take to obtain these players
- No premium exists in the top-25; approximately $2.o0-$2.50 premium thereafter
- Adding another position group (e.g. MI + CI) creates a higher premium than just a second position within the same group (e.g. 2B + SS)
- UT-only players represent the biggest bargains