
There is a LOT of information available for fantasy owners to try and digest these days. New writers and podcasts emerge every day (over 500 different fantasy analysts by last count). New stats and ways of slicing and dicing existing data are constantly emerging. Don’t get me wrong – I love the latest Statcast research as much as the next guy. But fantasy writers often pile up the acronyms and exotic statistics, as if 2000 words on spin rate has inherent interest just because it’s in-depth. It can be hard to find actionable fantasy moves in a table with 10 varying components of xStats.
I’m kicking off a new series today, utilizing data visualization to try and narrow in on fantasy baseball insights. Good visualization helps you achieve your goals by channeling success onto your subconscious until your reality lines up with your drea….I’ve been watching too much late-night Tony Robbins. Good data visualization takes complex raw data and translates it into easily-understood, actionable images.
The first question I’ll try to answer using data viz: how should I handle ERA this year?
- What ERA can I expect at any point in the draft?
- Who can I target if I need ERA help late?
- Which players are going to hurt my ERA at cost?
Let’s start with context:
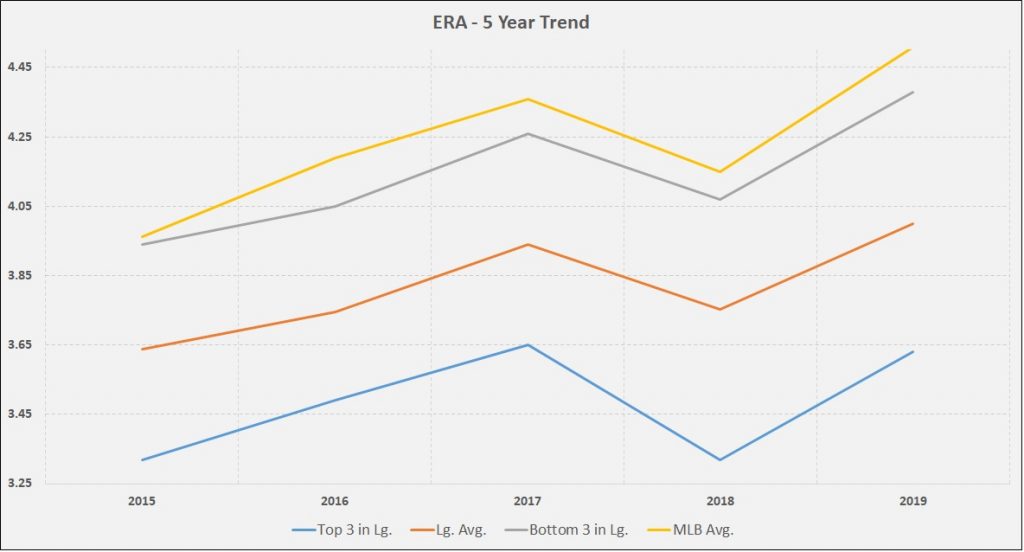
In 2019, we saw a massive jump in MLB ERA, and an accompanying drop in the ERA needed to compete in fantasy leagues. Based on 12-team NFBC leagues, last year the fantasy league average was a 4.00 ERA, compared to 3.75 in 2018. The top 3 last year averaged a 3.63 ERA.
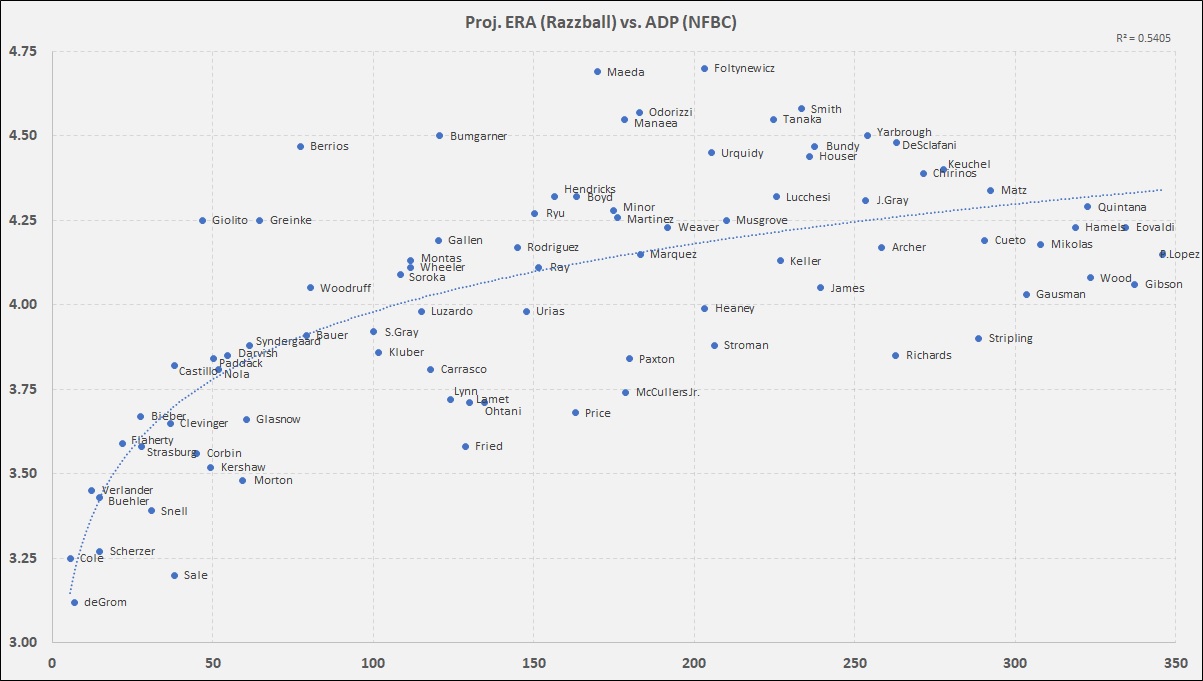
What about 2020? Only Rob Manfred knows what the baseball holds in store. Projection systems typically use a 3-year weighted average as their base; we can expect projections to include some of the ERA spike, but not all of it. The following chart showing Razzball/Steamer projected ERA, compared to NFBC ADP from the last two weeks, for SP with >99 IP:
Two caveats right off the bat:
1) OF COURSE you should be looking at other data. There are reasons why some of the players are above or below the line. K-rate matters. WHIP matters. IP matters. Hmm, those sound like good topics for future charty goodness…
2) Projecting ERA is notoriously difficult.
Caveats aside, let’s jump into the analysis. First of all, that trend line shows that if you want an ERA south of 3.75, it’s going to take a top-60 pick. By the time you hit pick 110, you’re getting close to a 4.00 projected ERA. Things level off from there, as you’re just barely above 4.30 ERA by pick 350. One lesson I’m taking? Protect your ERA early.
Next, let’s look at some ADP Bargains:
- Chris Sale: I was doubtful before the most recent injury concerns; even if he avoids TJ, seems like he’ll be limited with IP, quality, or both.
- Clayton Kershaw: for all of his injury concerns, he’s put up 178, 161, and 175 IP the last 3 years, and is projected for another 175 this year. Give me the 10 pick discount and Kershaw > Sale.
- Charlie Morton is coming off back-to-back years of 3.13/3.05 ERA, 1.16/1.08 WHIP, with big Ks and no apparent IP limits. Yet he’s cheaper than a bunch of guys with worse projections.
- Moving into the middle rounds, Max Fried jumps out with a 3.58 ERA and more than a K/IP.
- A pairing of Lance Lynn and Dinelson Lamet would net you strong ERA, 1.22 WHIP, and big Ks.
- David Price in LA looks tasty. The Dodgers will likely limit his IP, but hopefully that helps keep him healthy. Avoid Coors and his ERA in your starting lineup could easily approach 3.50, which you can’t say for anyone drafted after him.
- Marcus Stroman should give a solid ERA in the NL, if you can afford the hit to Ks and elevated WHIP.
- If you’re taking fliers on injury prone or IP-limited pitchers, do it on guys like McCullers, Richards, Stripling, and Wood, who should at least give you quality when they take the mound.
What about the flip side – who’s projected to hurt your ERA at ADP?
- Lucas Giolito: 2018 vs. 2019 for LG: ERA (6.13–>3.41), WHIP (1.48–>1.06), K/9 (6.5–>11.6), SIERA (5.37–>3.57). Steamer/Razzball projections are regressing him heavily.
- Zach Greinke: His performance over the last few years certainly justifies the ADP; projections are baking in some age decline, as well as regression towards the underlying skills (K-rate dropping, out-performed FIP/xFIP/SIERA the last few years).
- Jose Berrios: In three full seasons, Berrios has had a sub-4.00 ERA each year, although he beat xFIP/SIERA along the way. He’s still young. If you like him, other projection systems have him closer to a 4.00.
- Madison Bumgarner: Declining skills, velocity, and leaving San Francisco are all negative indicators.
- Kenta Maeda: Leaving Dodger stadium and swapping AL for NL are both negatives. We should expect an increase in IP and a corresponding increase in ERA/WHIP. But 4.69, for a pitcher who’s had 4 seasons between 3.48 and 4.22? His worst xFIP was 4.07 and worst SIERA 4.06. This will be one of my “beat the projections” bets.
- Mike Foltynewicz: In four seasons, his 2018 stands alone as the only playable fantasy year. I’m not chasing a rebound, when there are 25+ guys going later than him with much better projections.
Projections systems are optimized to get the most players right, and will miss many individuals each year, on both sides. But picking out exactly when projections are wrong is really hard. Systems have a hard time projecting a significant skills breakout… but so do we. If you can beat the best algorithms consistently, you can get a job with an MLB team! Use ERA projections as your base, and depart only when you feel very strongly about a given player’s skillset.