
Every time the calendar turns to July, Mets fans across the world cringe at the nearly $1.2 million that migrates from Fred Wilpon’s wallet into the $1,000 Gucci jeans Bobby Bonilla probably hasn’t washed since he left the Mets in 1999. It seems universal that massaging Bonilla’s contract was terrible in hindsight – these checks will keep coming until 2035 – but I was enlightened with information that one reason for deferral of the $5.9 million was to free up funds to sign Mike Hampton. One of the better hitting pitchers in history – Hampton hit .246 with 16 HRs in his career – Hampton went on to win the 2000 NLCS MVP for New York. The Metropolitans then selected David Wright eighth overall in the 2001 draft with the pick Colorado relinquished to sign Hampton. Why do we feel bad for Mets fans all the time, it could’ve been worse right? Wait… they promoted Tim Tebow and his .647 OPS to St. Lucie, yet Amed Rosario is still in Las Vegas? Syndergaard tore his lat muscle because the words “medical” and “staff” aren’t allowed to be paired in Flushing? Saturday Night was Asdrubal Cabrera bobblehead night – and somebody paid $40 for one? Alright, so maybe the Mets never got out of the woods.
All this Bonilla got me thinking about what exactly constitutes depth on the fantasy landscape. Well, it actually didn’t, but I had to find a way to bring up the great Bobby Bonilla along with the trials and tribulations of the Mets, while segwaying into my bit of fantasy baseball research, so here we are! Depth is complicated because of how different qualifiers – league format, roster construction, nuances – can affect exactly what it means when one says, “That position is deep,” or, “I like Player A, but outfield is so deep, so I can’t make room for him.” I took it upon myself to shed some light on both how positions as a whole have faired this season to date, and how Razzball is projecting the cookies to crumble rest of season.
A few things to note before we dig into the graphs.
- All information and rankings are based on Razzball’s Player Rater. Results are tailored to ESPN 12 team standard 5×5 rotisserie leagues.
- Eligibility for a given position is based on ESPN’s eligibility, shown on the Player Rater. For example, a player counted for purposes of the 2B line can simply be 2B eligible, or eligible at other positions like SS or 3B. This results in double counting of players – Jose Ramirez is counted as a 2B, 3B, and OF – but I do not believe it affects any of the results, as multi-position eligibility counts in the layman’s use of “depth” when referring to a certain position.
- Y-axis = how many players, eligible at the given position, are currently ranked between 1st and 100th, 101st and 200th, etc. Arbitrary? Yes, but it’s intuitive nonetheless.
- X-axis = buckets based on overall rank
- Everything is consistent between the two graphs, click on them to get a closer view. As far as color schemes, this was the best I could do!
- If you have any questions, or desire a copy of the tables that went into the graphs, or even the graphs themselves, I don’t mind supplying them for your own tinkering! Shoot me a mention and follow on Twitter, or comment below – @LanceBrozdow.
- Please consult your doctor before using these graphs. Excessive exposure can lead to rash, headaches, nausea, confusion, color blindness, and most importantly, hindsight bias (Bobby Bonilla!).
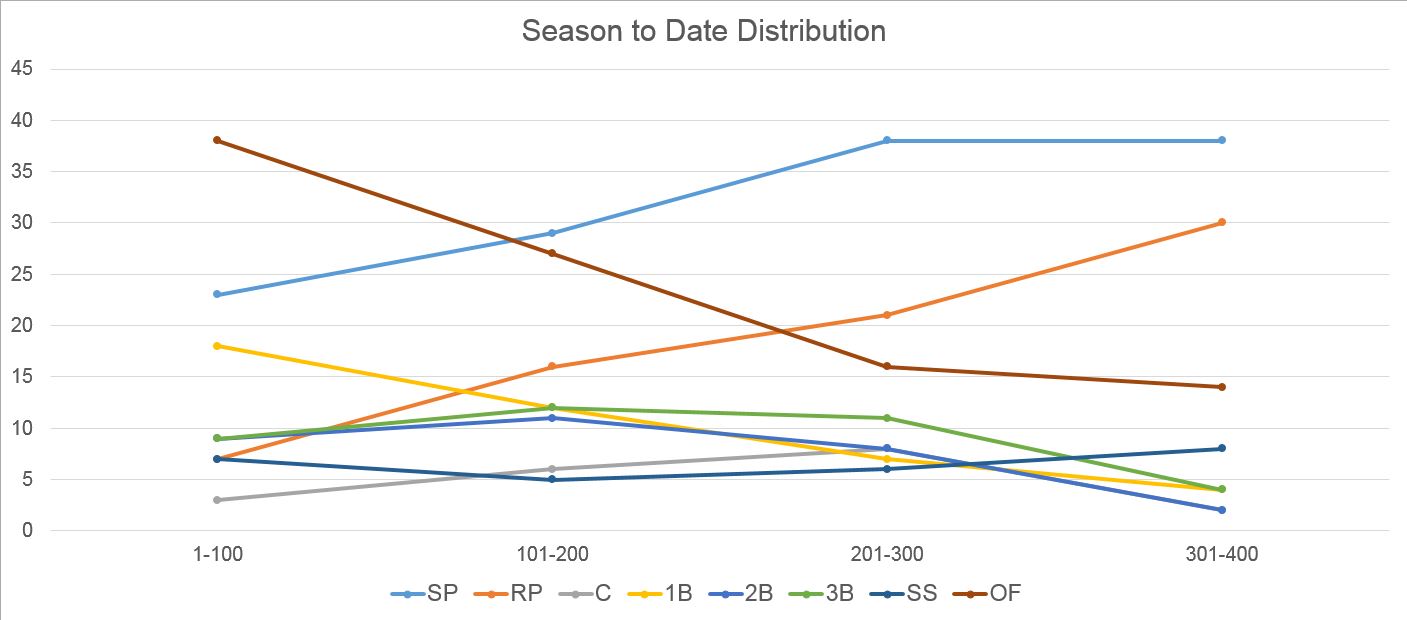
Here is our distribution season to date (prior to games on July 1st).
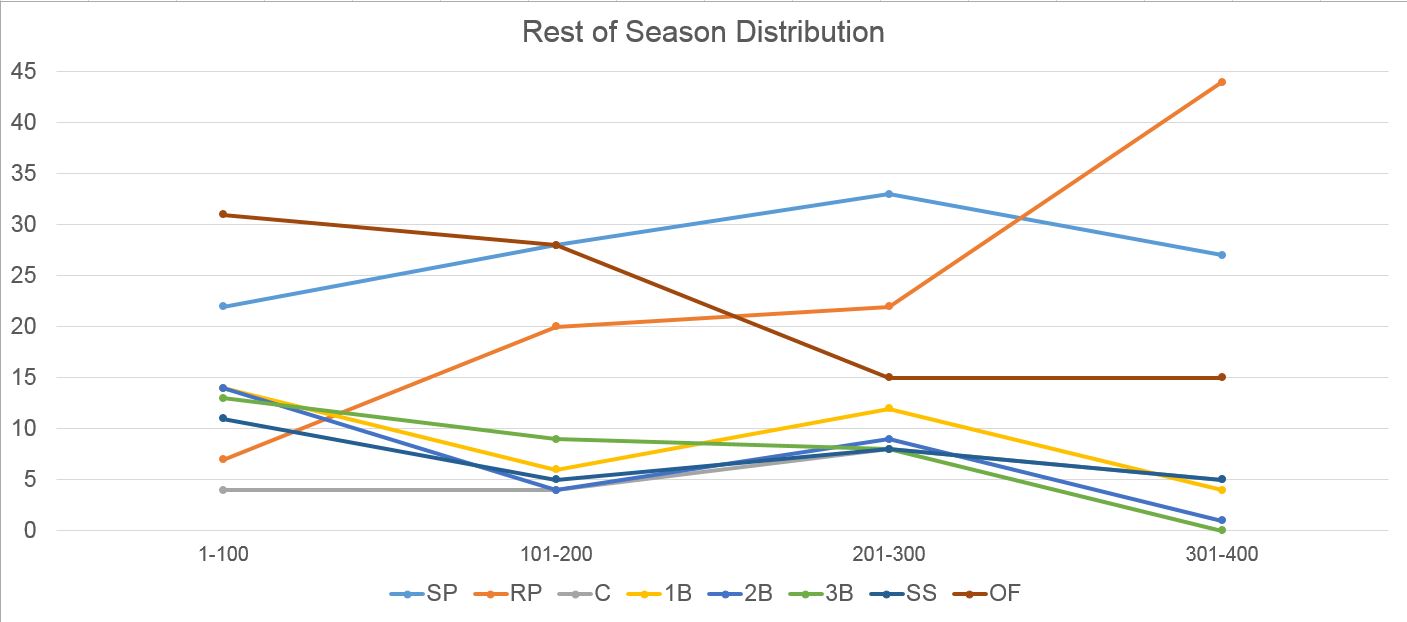
And now our rest of season projections…
From my analysis, I found there is value in both looking reflectively on what has already happened, and comparing that to the changes between the two distributions. First thing that jumps out is how much elite talent has found its way to first base. 18 of the top 100, double that of any other non-outfield position, and 30 total players inside the top 200. Last season we heard a lot about how the flyball revolution strapped rocket boosters to middle infielders, like Freddy Galvis, to reach much higher home run totals than we ever thought possible. This year, it seems like the juiced ball theory is showing its stripes at the corner more than up the middle. Cody Bellinger, Mark Reynolds, Justin Smoak, and Logan Morrison have all returned top 50 value and none of whom were drafted anywhere near their present valuation. Players between 101-200, like Joey Gallo and Trey Mancini have also boosted the depth of first base.
Comparing the yellow, first base line on the season to date graph to the same line on the rest of season graph shows you that although some natural trail off in dominance is expected inside the top 10o, the position’s production as a whole doesn’t appear to be a wild fluke. Razzball’s Player Rater has 14 first base eligible players inside the top 100 rest of season, even with a position that season to date, only has nine inside the top 100, second base. In simpler terms, first base has overperformed and second base has underperformed, with correction the prediction made by the Razzball Player Rater.
A position once devoid of power and production, second base is now expected to vault players like Rougned Odor, Jose Peraza, and DJ LeMahieu, all currently outside of the top 100, inside that same threshold. Shortstop also gets a second base-like bump, represented by the darkest blue line on the season to date graph. The line is flat from bucket-to-bucket, and finds itself much closer to the gray catcher line than any of us should be comfortable with. With only seven more players currently represented in the top 400 than the catcher position – every other position has at least 11 more representatives than catcher – early round picks back in March, Carlos Correa and Corey Seager are buoying those who believed from the start that shortstop was the position to target early.
Now turning our focus to the three positions which make up the majority of any one team’s roster – starting pitcher, reliever, outfield – observing the trends on my two graphs for these lines is much easier to follow. Noteworthy is how much more faith the Player Rater has in relievers from 201-400 overall over starters, when just the opposite has been accurate in terms of production to date. Although the assumption has been relatively inaccurate to date (shown in the season to date graph above, the theory as a whole still stands its ground well. If you’ve ever played in one of Razzball’s RCLs, you’ve experienced this theory in practice first hand. I would venture a guess that a strong majority of the elite teams have roster construction that favors closers, speculative save options, and high strikeout middle relievers, over starting pitchers in the 48th (SP4) overall and beyond ranking. For those that don’t know, the idea is to drive down your ratio stats and keep your strikeouts a tick above your innings total on the season; the Player Rater strongly agrees.
As we’ve seen with starters like Ervin Santana and Jason Vargas this season, peripherally, there is serious reason to worry about any resemblance of their current production manifesting rest of season. Factor in the contextual evidence that starters like Madison Bumgarner and Noah Syndergaard who were highly ranked preseason, have diminished value season to date because of injuries, and echoing the skepticism about starting pitcher in comparison to relievers, is easy to rationalize. Relievers make up 74 of the top 400, but are projected to make up 93 of the top 400 rest of season. That’s a 25% increase in representation, the highest appreciation of any other position between season to date and rest of season. It’s a play on both the unpredictability of starting pitchers results and health, combined with the belief in the reliever integration approach. I’m a believer.
Outfield is the position that I’ve often heard associated with the “depth” phrasing I mentioned earlier. Although it possesses the steepest downward slope season to date among any other position, just how much value you can harness from a player forgotten during the preseason is impressive. 81 outfield eligible players are present between 1-300 overall, meaning in a standard, 12 team league, that allocates almost seven outfielders inside the top 300 per owner. Nearly every starting outfielder on each major league team, could feasibly be represented inside the top 300. To give this even more perspective, in NFBC leagues, only 66 outfielders had an average draft position under 300 overall. Owners were willing to gamble on other assets and it worked out in their favor, as players like Leury Garcia and Eddie Rosario have found relevancy, whether you’re inclined to add them or not. Outfield is very, very deep; to the point where it’s hard to find one that doesn’t spit back top 300 production. Representatives within the top 300 tails off from 81 to 74 rest of season, naturally projecting a bit of regression for players like Michael Conforto and Cameron Maybin, but still ample room for five quality outfielders per team in a 12 team league.
I hope this exercise was as valuable to you as it was for me to think through. I feel as though we fantasy baseball owners get lost in the weeds a lot, and high-level reflection on the state of the fantasy landscape, as well as trends like this are valuable to help us see the bigger picture in leagues. Do with the information whatever you wish, I’ll always be in the comments below to discuss along with you all. Enjoy your Fourth of July!
Questions and comments encouraged, Twitter – @LanceBrozdow