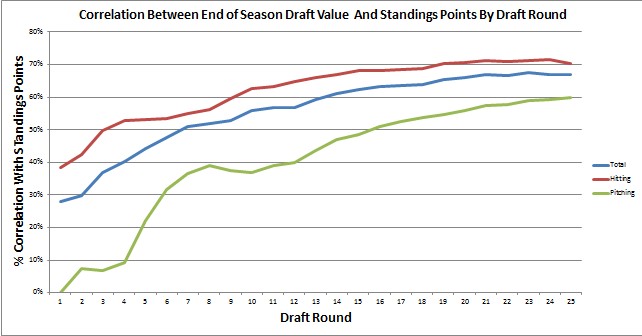
In my 2013 review of Fantasy Baseball Rankings, I noted how the majority of a team’s success (in 12-team mixed roto leagues) can be tied to the end-of-season value of their team. Those stats are:
- Drafted Hitter+Pitcher End of Season Value – 66.9% correlation with Team Total Standings Points (2013)
- Drafted Hitter End of Season Value = 70.5% correlation with Team Hitter Standings Points (2013)
- Drafted Pitcher End of Season Value = 60.0% correlation with Team Pitcher Standings Points (2013)
In my review of Hit/Pitch Splits in Fantasy Baseball Snake Drafts, I showed the impact of how a team’s investment in hitting vs starting pitching vs relief pitching correlated with Razzball Commenter League team success (note: leagues now open – commishes welcome!).
This post will provide some insights on the cumulative round-by-round impact of how a team’s draft drives a fantasy team owner’s success (or lack thereof).
The below graph is based on the 64 12-team mixed Razzball Commenter Leagues in 2013. If you focus on ‘Round 4’, the graph shows that the end of season value of a team’s 1st-4th round hitters explains about 53% of a team’s hitting standing points (red line), 1st-4th round pitchers explains about 9% of a team’s pitching standing points, and the sum of all 1st-4th round picks explain 40% of a team’s total standings points)

Conclusions/Comments
- The end-of-season value of a team’s 1st round predicts nearly 40% of a team’s hitting points and nearly 30% of a team’s total standings points. No pressure, right?
- The hitter curve plateaus about mid-way through the draft. This suggests to me that the quantity and/or impact of drafted “sleepers” is minimal (for shallow mixed leagues at least).
- The pitching curve starts really slow as, even by the 4th round (at 9%), only 60% of teams have drafted a pitcher. But if taking pitchers in those first 4 rounds was an overwhelming advantage, those 60% should see higher standings points than the 40% who hadn’t drafted. I interpret this as drafting 0-1 pitchers in the first 4 rounds is fine but there is no proof that drafting 2 or more pays dividends.
- The pitching curve has a huge spike from the 4th to 8th rounds, jumping from 9% to 39%. By this time, the average team has drafted 2.3 pitchers. But the hitter curve hits 39% after the first round alone. So while getting your top 2 SPs right is very important, its importance on team success is about equivalent to your first pick.
- The plateauing hitter curve (after about the 12th round) plus the consistently rising pitcher curve is making me consider punting more hitting positions in the late ‘teen’ rounds in favor of grabbing up whatever’s left on my SP/RP wish list.


