In recent posts, I used the results of our 2013 Razzball Commenter Leagues (based on 64 12-team mixed leagues with daily roster changes and unlimited pickups) to show:
- The end of season value of a team’s hitters explains about 70% of a team’s final season Hitting Standings Points
- The PROJECTED value of a team’s hitters before the draft explains on average only 15% of a team’s final season Hitting Standings Points (with a range in 2013 from 2% to 37%)
- Thus, about 55% of a team’s hitting success is driven by deviations from what was projected and what actually happened (drafter prescience may be part of this but it is likely driven by good/bad luck in hitter performance and health)
So this leaves 30% of Hitting Standings Points that could be attributed to a manager’s in-season moves.
Inspired by one of our commenters (initials SF), I thought of a way to reduce the size of that 30% black box. While estimating the quality of a manager’s in-season moves is very complicated, estimate the quantity of a manager’s moves is EZPZ. That would be interesting…..but what kind of guidance would that provide? Making roster moves just for the sake of it is a waste of time and if you, our loyal readers, are going to waste your time, we prefer you do it on our site vs. your league site.
So I settled upon using a team’s total ABs as my ‘quantity’ metric since this is the most effective outcome from high quantities of hitter moves that has nothing to do with the actual quality of these roster moves. Even if a fantasy baseball manager was below average at selecting free agent hitters (on off days for starting hitters), they still likely benefited more than doing nothing since four of the five standard hitting categories are counting stats. It is certainly possible for a team with moderate manager intervention but incredible player health to get a high number of team ABs but teams with large deviations from the average team AB totals are mostly driven by in-season management.
Note #1: I will also be publishing a post soon that measures the impact of maximizing team IP so fantasy baseballers can understand how to best leverage their bench spots.
Note #2: Our awesome 2013 RCL commissioner – will miss ya VinWins – did not collect quantity of transactions but I would have passed on it in favor of ABs even if he had.
What percentage of a team’s hitting standings points can be attributed to their maximization of ABs?
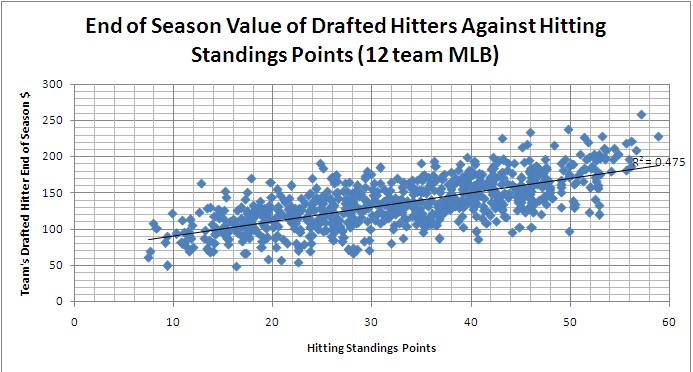
Below is a scatter graph that illustrates how end of season drafted hitter value explains ~70% (R^2 of 47.5%) of RCL team hitter standings points. Note that all ‘actual’ standings points in this analysis are based on how the team compared against all 768 RCL teams (scaled to 12 roto points per category) versus their specific league.

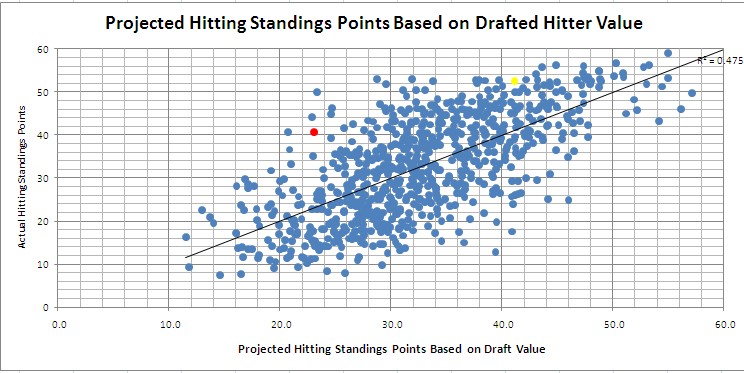
Based on the resulting formula from this analysis (-0.14+.241*Hitting Draft Value), I can convert the above graph into one showing ‘projected’ hitting standings points vs. actual based solely on the value of their drafted hitters.

The red dot is my team. The yellow dot is Grey’s team. Based on my model (the trend line), everyone above the line ‘overperformed’ the average team effectiveness of in-season moves and everyone below it ‘underperformed’. As you can see, there are quite a number of dots far above/below the trend line.
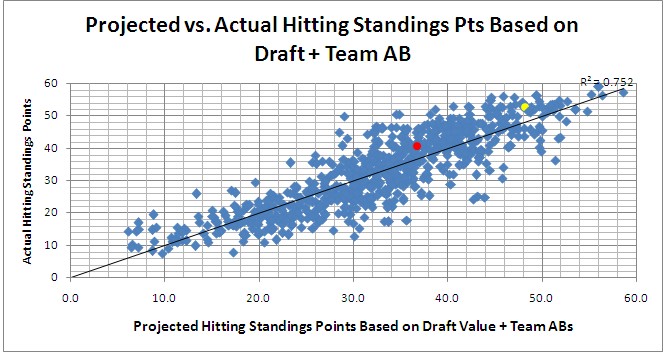
I then ran a regression test with the end of season value of drafted hitters and total team ABs. With just these two data points, the correlation between actual and projected standings points jumps from 69% to 86.7% (R^2 increase from .475 to .752). In other words, the number of team AB is a very good predictor of team success above and beyond how well a team drafted. (The formula is -76.62+.012*Total AB+.163*Team Drafted Hitter Value)

While an equal number of teams fall above/below this new trendline, the dots are more tightly packed as the model is smarter. Grey and I’s teams are still above the trendline but not by much. I believe this is a case where the quantity of our ABs was the primary reason we finished higher than the trendline in the first model because our AB totals were extraordinary – I finished 11th out of 768 RCL teams in total ABs while Grey was 17th. With this extra piece of information, the majority of our ‘overperformance’ has now been explained.
Note: There is a common phrase that ‘correlation does not imply causation’ – e.g., just because a windmill spins faster on windy days does not mean that the windmill is the cause of the wind. But I think this is a case of correlation and causation because there is such an obvious connection between counting stats and ABs. I had 650 (?!?!) more ABs than the average team in my league (excluding me). You think having the equivalent of a 14th hitter might have helped my R/HR/RBI/SB?
Based on this regression analysis, I would now explain a team’s hitting standings points in a 12-team mixed format like RCL as follows:
- ~70% based on how your draft goes (only ~15% of this 70% could be gleaned by pre-season rankings)
- ~17% based on how you maximize ABs
- ~13% based on the quality of one’s in-season moves (and possibly other factors)
Before I move on, just a note. These results do not mean that the quality of those ‘maximized ABs’ is irrelevant. It means that the quantity of a team’s ABs based on average decision-making in an average RCL explains 17% of a team’s success.
Additional note/sales pitch – the best to improve the quality of those additional ABs is through our Hitter-Tron which has gameday values for every hitter as well as values for the next 7 days. Hitter-tron, if you’re not using it, the guy kicking your ass in your league is.
Quantifying ‘Hitting Grind Points’
Here is a look at the RCL Expert league ‘projected’ vs ‘actual’ hitting standings points based on just drafted hitter value and the combination of drafted hitter value + total ABs.
| Team | Hit Pts (overall) | Hit Draft Value $ | Projected Hit Pts Based on Draft | AB | Projected Hit Pts Based on Draft + AB | AB Grind Points |
| Team Podhorzer | 56.02 | 196.9 | 47.3 | 7,416 | 45.9 | -1.4 |
| Razzball Grey | 52.55 | 171.1 | 41.1 | 7,950 | 48.2 | +7.2 |
| Team sayre | 45.12 | 130.5 | 31.3 | 7,171 | 32.1 | +0.8 |
| Razzball Rudy Gamble | 40.58 | 96.6 | 23.1 | 8,008 | 36.8 | +13.6 |
| Team Singman | 38.88 | 133.7 | 32.1 | 7,126 | 32.1 | 0.0 |
| Mastersball.com Carey | 35.99 | 161.7 | 38.8 | 7,142 | 36.8 | -2.0 |
| Team Roto | 35.12 | 122.2 | 29.3 | 7,596 | 35.9 | +6.6 |
| Team Minnix | 31.97 | 80.3 | 19.2 | 7,497 | 27.9 | +8.7 |
| Team Pianowski | 23.97 | 170.8 | 41.0 | 6,897 | 35.3 | -5.7 |
| Team Davenport | 21.14 | 139.7 | 33.5 | 6,562 | 26.2 | -7.3 |
| Team Guilfoyle | 20.48 | 91.4 | 21.9 | 7,021 | 23.9 | 2.0 |
| Team Carty | 18.99 | 83.3 | 19.9 | 7,280 | 25.7 | 5.8 |
Three points to make on the above:
1) My team had the most ABs in the league and had the highest number of ‘hitting grind points’. Based strictly on my draft, the model would predict only 23.1 hitting points. After factoring in my high AB total, it now estimates 36.8 points. The ‘hitting grind points’ are the difference between those two estimates.
2) While the standings projection model is clearly not perfect (note Podhorzer’s had 10 more standings points than projected), the model including ABs comes much closer to projecting each team’s actual hitting points (6th column) than using the model that just incorporated the drafted value (4th column). Look how Ryan Carey of Mastersball had a $65 advantage on me after draft day (equating to 15 standings points) yet I finished with 4.58 more hitting points. That’s a 20 standings points gap of which my AB advantage (~800) explains 75% (the model predicts us even, eliminating that post-draft 15 standings points advantage).
3) The impact of maximizing team ABs is greatest for teams with poor drafts and least for teams with great drafts. It should intuitively make sense that teams with bad drafts have more hitting standings points to gain from grinding it out than a team that drafted well. Mike Podhorzer’s (of FanGraphs/RotoGraphs) team was already projected at 47.3 hitting points. If you would add my ‘grind points’ to that estimate, he’d be over 60 standings points! So while Grey nearly matched me in ABs, that only contributed an extra +7.2 ‘grind points’ because he had better draft results than me (damn you Braun, Ike Davis, and Rutledge!)
Here is a neat little grid that shows what the model projects as ‘hitting grind points’ based on various draft outcomes and AB totals:
| Team AB Percentile | |||||
| 25th (6,865) | 50th (7,243) | 75th (7,526) | 100th (8,286) | ||
| Draft Hitter Value Percentile | 25th ($114) | (1.6) | 3.0 | 6.5 | 15.7 |
| 50th ($134) | (3.2) | 1.4 | 4.9 | 14.2 | |
| 75th ($159) | (5.1) | (0.5) | 2.9 | 12.2 | |
| 100th ($259) | (12.9) | (8.3) | (4.9) | 4.4 | |
So a team that has an average draft for hitting (50th percentile) could net up to 14.2 ‘grind points’ if they were to hit the 100th percentile in ABs but are helping their cause even if they reach the 50th percentile in ABs. For a team with a great draft, however, the only way to avoid losing points is to hit well above the 75th percentile in ABs.
The Reduced Effectiveness Of `Hitting Grind Points’ In A Super-Competitive League
All of the above analysis is based on the RCL averages. The average league in the RCL had 7,141 AB/team.
I re-ran the analysis based solely on teams with 7,500+ ABs (note: our most competitive league – the ECFBL – averaged 7,683 AB/team!) and the results were that the draft explained about 60% of a team’s hitting standings points (vs. ~70%) and their total ABs only boosted the correlation up to 63.5%. That leaves a much greater percentage of team success (36.5% vs. 13%) that goes under the ‘Quality of In-Season Moves’/Other bucket.
Essentially, grinding out ABs in a super-competitive league is a cost of doing business. Analogically, while working 100 hour weeks may help you get ahead at your white collar job, they just keep you employed at an Asian sweatshop.
Here is the revised ‘Hitting Grind Points’ grid based on all teams with 7,500+ ABs:
| Team AB Percentile | |||||
| 25th (7,107) | 50th (7,500) | 75th (7,893) | 100th (8,286) | ||
| Draft Hitter Value Percentile | 25th ($114) | (1.9) | 1.9 | 3.8 | 5.7 |
| 50th ($134) | (2.0) | 1.8 | 3.7 | 5.6 | |
| 75th ($159) | (2.1) | 1.7 | 3.6 | 5.5 | |
| 100th ($259) | (2.6) | 1.2 | 3.2 | 5.1 | |
Thus, the more this analysis encourages all RCLers to maximize ABs, the more grinding out ABs becomes table stakes and the advantage becomes neutralized. But if people in your other leagues do not read Razzball, you are all set.
Impact in Daily Roster Leagues (where you can make next-day pickups) and Weekly Roster Change Leagues
I do not have any league data on these formats but my guess is that quantity of ABs is still a factor above and beyond drafted hitter performance – just less so.
For daily roster change leagues without same-day pickups (you can pick up a guy for tomorrow), you can maximize ABs by 1) Promptly replacing injured players (duh), 2) Benching players on their team’s off days, 3) Having a bench guy available to swap in when one of your starting players gets an unexpected day off. Since you will also want bench spots available for pitchers, one way to maximize your bench is to have a multi-position eligibility guy at UTIL or on your bench. Yahoo’s two UTIL default setting provides an additional opportunity to do this. I wouldn’t mind reaching a round or two for Brandon Moss knowing I can swap him into 1B/OF/UTIL and that his playing time is very predictable (starts against RHP, sits against LHP).
For weekly roster change leagues, there isn’t much you can do except 1) Promptly replacing injured players and 2) Rotating in bench hitters whose teams play more games than a starter’s team (assuming both have similar ABs/Game and likelihood to start). In reality, I imagine the only correlation you would see here is a negative correction for abandoned teams who failed to replace injured or benched players.
Conclusions
- Maximizing a team’s ABs is the #1 most effective way to improve your fantasy team’s hitting success that is completely in your control in daily roster change leagues.
- The effectiveness of this strategy is positive for all participants in leagues (even the team that drafted the best offense can still benefit) with the greatest benefit for poorly drafted teams who have the most to gain. The success of your offense vs. pitching should dictate how much of your bench you reserve for hitting vs. pitching (in last year’s RCL where my pitching was much better than my offense, I was using 2 and sometimes all 3 bench spots for hitters while Grey was doing the reverse)
- Take multi-position eligibility players into account on draft day to provide better roster flexibility for swapping out inactive hitters on a given day.
- In super-competitive leagues, failing to maximize ABs will cost you some a couple of standings points on average. Consider it table stakes.
- If you do not have the time/stomach to maximize team ABs and some people in your league do, DO NOT JOIN THAT LEAGUE. I say that not because you are doing the other guys a disservice – it is simply because you have very little chance of winning even if you nail the draft. Get in a weekly roster change league. If it makes you feel better, I am very selective in the daily roster change leagues I join BECAUSE I know the commitment that they require.


