This post is a sequel to this post on maximizing ABs.
In recent posts, I used the results of our 2013 Razzball Commenter Leagues (based on 64 12-team mixed leagues with daily roster changes and unlimited pickups) to show:
- The end of season value of a team’s pitchers explains about 59% of a team’s final season Pitching Standings Points
- The PROJECTED value of a team’s pitchers before the draft explains on average only 3% of a team’s final season Pitching Standings Points (with a range in 2013 from -6% to 15%)
- Thus, even with the best performing rankings, 44% of a team’s pitching success is driven by deviations from what was projected and what actually happened (drafter prescience may be part of this but it is likely driven by good/bad luck in pitcher performance and health)
So this leaves 41% of Pitching Standings Points that could be attributed to a manager’s in-season moves.
What percentage of a team’s pitching standings points can be attributed to their maximization of IP?
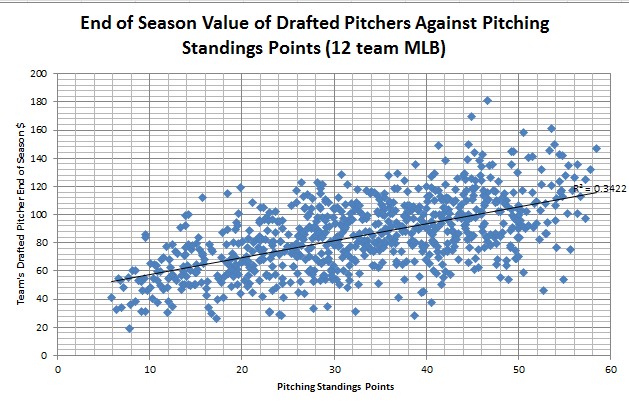
Below is a scatter graph that illustrates how end of season drafted pitcher value explains ~60% (R^2 of 34.2%) of RCL team pitcher standings points. Note that all ‘actual’ standings points in this analysis are based on how the team compared against all 768 RCL teams (scaled to 12 roto points per category) versus their specific league.
This analysis assumes a 12-team mixed league with a 180 GS cap, no IP cap, and unlimited daily roster moves.

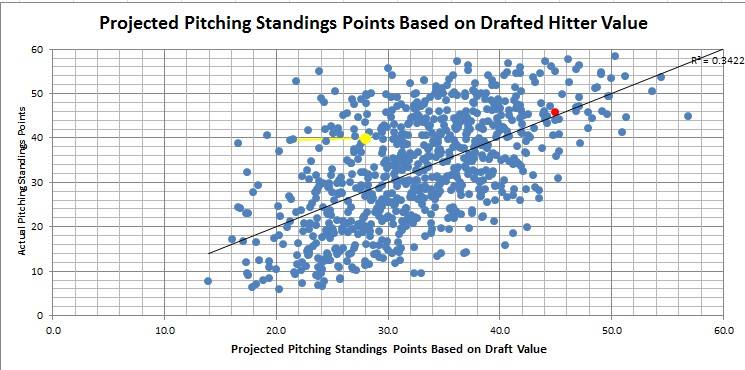
Based on the resulting formula from this analysis (8.55+.285*Pitching Draft Value), I can convert the above graph into one showing ‘projected’ pitching standings points vs. actual based solely on the value of their drafted pitchers.

The red dot is my team. The yellow dot is Grey’s team. Based on my model (the trend line), everyone above the line ‘overperformed’ the average team effectiveness of in-season moves and everyone below it ‘underperformed’. As you can see, there are quite a number of dots far above/below the trend line.
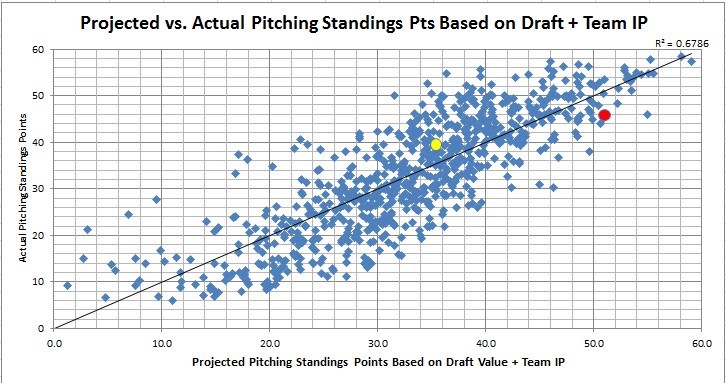
I then ran a regression test with the end of season value of drafted pitchers and total team IP. With just these two data points, the correlation between actual and projected standings points jumps from 59% to 82.4% (R^2 increase from .342 to .679). In other words, a team’s innings pitched total is a very good predictor of team success above and beyond how well a team drafted. (The formula is -62.767+.05883*Total IP+.20188*Team Drafted Pitcher Value)

While an equal number of teams fall above/below this new trendline, the dots appear more tightly packed as the model is smarter. Grey remains above the trendline but not by as much. My dot now dips under the trendline. Both of us were much higher than average for RCL (Rudy=62nd, Grey 156th) though nowhere near as high as we were in ABs (where we were both in the top 20).
Based on this regression analysis, I would now explain a team’s pitching standings points in a 12-team mixed format like RCL as follows:
- ~60% based on how your draft goes (with only an average of 3% estimated by pre-season rankings)
- ~22% based on how you maximize IP
- ~18% based on the quality of one’s in-season moves (and possibly other factors)
Before I move on, just a note. These results do not mean that the quality of those ‘maximized IP’ is irrelevant. It means that the quantity of a team’s IP based on average decision-making in an average RCL explains 22% of a team’s success.
Quantifying ‘Pitching Grind Points’
Here is a look at the RCL Expert league ‘projected’ vs ‘actual’ pitching standings points based on just drafted pitching value and the combination of drafted pitcher value + team IP.
| Team | Pitch Pts (overall) | IP | Pitch Draft Value $ | Projected Pitch Pts Based on Draft | Projected Pitch Pts Based on Draft + IP | IP Grind Points |
| Razzball Rudy Gamble | 45.82 | 1,495.2 | 127.8 | 44.9 | 51.0 | +6.1 |
| Team Sayre | 39.26 | 1,438.2 | 105.7 | 38.7 | 43.2 | +4.5 |
| Razzball Grey | 39.92 | 1,432 | 68.1 | 27.9 | 35.2 | +7.3 |
| Mastersball.com Carey | 34.78 | 1,421.2 | 51.3 | 23.2 | 31.2 | +8.0 |
| Team Minnix | 34.15 | 1,418 | 63.8 | 26.7 | 33.5 | +6.8 |
| Team Podhorzer | 28.64 | 1,388.1 | 72.5 | 29.2 | 33.5 | +4.3 |
| Team Roto | 45.94 | 1,378.2 | 134.4 | 46.8 | 45.4 | -1.4 |
| Team Carty | 37.43 | 1,351.2 | 88.1 | 33.6 | 34.5 | +0.9 |
| Team Singman | 34.8 | 1,330 | 100.7 | 37.2 | 35.8 | -1.4 |
| Team Guilfoyle | 26.68 | 1,283.2 | 82.4 | 32.0 | 29.4 | -2.7 |
| Team Davenport | 26.64 | 1,269 | 112.9 | 40.7 | 34.7 | -6.0 |
| Team Pianowski | 11.88 | 1,243.1 | 30.8 | 17.3 | 16.6 | -0.7 |
Four points to make on the above:
1) My team had the most IP in the league (I hit the daily double with AB) but only the fourth highest total of ‘pitching grind points’. Grey is a better example to look at here as, based solely on his disappointing draft (e.g., Niese, Estrada), the model projected only 27.9 pitching points. But once his 1,432 IP are factored in (100 more than average), the model projects him at 35.2 points which is much closer to his actual 39.9 point finish (he made a trade for David Price that helps explain some of the remaining difference). The difference between the original 27.9 pitching point projection and the revised 35.2 point projection represents the ‘pitching grind points’ in the right-hand column.
2) The ‘standings points’ are based on the master standings across 64 leagues. Because the Expert league had a higher average IP (1,370 vs. 1,330), the league’s total ‘pitching grind points’ is greater than zero (in a league with RCL average IP, I’d expect the sum to be at or near zero).
3) While the standings projection model is clearly not perfect, the model including IP (6th column) comes much closer to projecting each team’s actual pitching points than using the model that just incorporated the drafted value (4th column). The model does a solid job at predicting the order of the 12 teams with the biggest outlier being the team of Dr. Roto (of Sirius/XM and RotoExperts).
4) The impact of maximizing team IP is greatest for teams with poor drafts and least for teams with great drafts. It should intuitively make sense that teams with bad drafts have more pitching standings points to gain from grinding it out than a team that drafted well. So Grey had more ‘pitching grind points’ than me despite the fact that I had 63 more IP than him.
Here is a neat little grid that shows what the model projects as ‘pitching grind points’ based on various draft outcomes and IP totals:
| Team IP Percentile | |||||
| 25th (1,258) | 50th (1,340) | 75th (1,416) | 100th (1,680) | ||
| Draft Pitcher Value Percentile | 25th ($67) | (2.8) | 2.0 | 6.5 | 22.0 |
| 50th ($84) | (4.3) | 0.5 | 5.0 | 20.5 | |
| 75th ($102) | (5.8) | (1.0) | 3.5 | 19.0 | |
| 100th ($180) | (12.3) | (7.5) | (3.0) | 12.5 | |
So a team that has an average draft for pitching (50th percentile) could net up to 20.5 ‘grind points’ if they were to hit the 100th percentile in IP but are helping their cause for every IP over the RCL AVG of 1,340. For a team with a great draft, however, the only way to avoid losing points is to hit well above the 75th percentile in IP.
It should be noted that the 100th percentile in both IP and draft value are extreme. Only 5 teams out of 768 reached 1,600 IP and only 56 even reached 1,500. Only 30 teams managed $130+ in pitching value with only 10 of those teams reaching RCL average hitter draft value.
The Reduced Effectiveness Of `Pitching Grind Points’ In A Super-Competitive League
All of the above analysis is based on the RCL averages. The average league in the RCL had 1,332 IP/team.
I re-ran the analysis to simulate a league with an average IP of 1,450 IP/team (note: our most competitive league – the ECFBL – averaged 1,517 IP/team!) and the results were that the draft explained about 51% of a team’s pitching standings points (vs. 59%) and their total IP only boosted the correlation up to 69%. That leaves a much greater percentage of team success (31% vs. 18%) that goes under the ‘Quality of In-Season Moves’/Other bucket.
As with ABs, grinding out IP in a super-competitive league is a cost of doing business. Repeating the analogy, while working 100 hour weeks may help you get ahead at your white collar job, they just keep you employed at an Asian sweatshop.
Here is the revised ‘Pitching Grind Points’ grid based on leagues with an average of 1,450 IP:
| Team IP Percentile | |||||
| 25th (1,403) | 50th (1,436) | 75th (1,487) | 100th (1,680) | ||
| Draft Pitcher Value Percentile | 25th ($67) | (2.9) | (0.8) | 2.4 | 14.7 |
| 50th ($84) | (3.0) | (0.9) | 2.3 | 14.6 | |
| 75th ($102) | (3.0) | (0.9) | 2.3 | 14.6 | |
| 100th ($180) | (3.3) | (1.2) | 2.0 | 14.3 | |
Thus, the more this analysis encourages all RCLers to maximize IP, the more grinding out IP becomes table stakes and the advantage becomes neutralized. But if people in your other leagues do not read Razzball, you are all set.
Impact in Daily Roster Change Leagues With IP Caps or No GS/IP Caps and Weekly Roster Change Leagues
For leagues with IP caps vs. GS caps, the impact of maximizing IP depends on the strictness of the cap. If it’s above 1,400, I think there are some opportunities to take advantage. Anything lower and this advantage has been neutralized.
For leagues with no GS/IP caps, the impacts would be different than the above because it adds a third potential pitching strategy to the mix (#3 below):
1) Get to 180 GS, use RP to a ‘league average’ extent (net – 1,330 IP)
2) Get to 180 GS, aggressively use Middle Relievers in SP spots on off days to increase total IP (net ~1,450 IP)
3) Aggressively go with starting pitchers to maximize Wins and Ks, rolling the dice on ERA/WHIP (net 1,500+ IP?)
This third strategy is also commonly found in H2H leagues. I imagine the results here are similar to the competitive league where one HAS to chase innings through all means necessary just to have a fighting chance in Wins/Ks.
For weekly leagues, the 2nd strategy goes away. It’s really a matter of deciding your SP/RP mix with heavy SP favoring Wins/Ks and heavy RP favoring Saves/ERA/WHIP. There is no inherent advantage to either strategy but I have found teams that draft hitting-heavy are best served to go with the former (because their ratios are going to be poor anyway).
Conclusions
- Maximizing a team’s IP is the #1 most effective way to improve your fantasy team’s pitching success that is completely in your control in daily roster change leagues.
- The effectiveness of this strategy is positive for all participants in leagues (even the team that drafted the best pitching can still benefit) with the greatest benefit for poorly drafted teams who have the most to gain. The success of your offense vs. pitching should dictate how much of your bench you reserve for hitting vs. pitching (in last year’s RCL where my pitching was much better than my offense, I was using 2 and sometimes all 3 bench spots for hitters while Grey was doing the reverse)
- In GS cap leagues, maximizing IP requires rotating in middle relievers during SP off-days or – in the more extreme case – using one or more roster spots to stream starters and using RPs in those slots the other days. In leagues with high to no IP caps, one can use both SP and RP to maximize innings. The strengths of your team will dictate how best to balance this (e.g., if you are dominating ERA/WHIP and trailing Wins/Ks, up the SP usage. If you are doing good in those stats, use more RPs)
- In super-competitive leagues, failing to maximize IP will cost you some a couple of standings points on average. Consider it table stakes.
- If you do not have the time/stomach to maximize team IP and some people in your league do, DO NOT JOIN THAT LEAGUE. I say that not because you are doing the other guys a disservice – it is simply because you have very little chance of winning even if you nail the draft. Get in a weekly roster change league. If it makes you feel better, I am very selective in the daily roster change leagues I join BECAUSE I know the commitment that they require.
Final Conclusion/Thoughts – Factoring in the Maximizing AB Analysis
Both the AB and IP analyses conclude that maximizing AB and IP are crucial tactics for winning 10-12 mixed leagues with daily roster changes (particularly Roto but H2H/Points to an extent as well).
So how should one balance these two tactics as part of their bench (and worst 2-3 starting player) strategy?
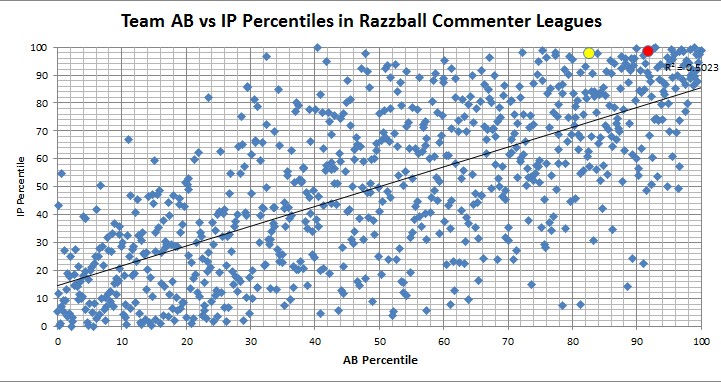
Let us first look at what is possible. If we look at yet another scatter graph comparing RCL team AB and IP totals from 2013, there is a somewhat surprising insight. While one might think that AB and IP maximization are a zero-sum game since there’s a finite bench, that is not the case. There is a strong positive correlation (~75%) between a team’s AB and IP totals. There are a number of teams that appear in the the top right (high in both) and bottom left (low in both). So while this SEEMS like a tradeoff one needs to make, that is not the reality. The only obstacle behind maximizing both is your willingness to commit the necessary time. (Note: The red dot is me, the yellow dot is Grey)

I can tell you that, for me, it was a lot more time maximizing AB vs. IP because I had so many batting lineup spots to fill. Pitching was easy because I drafted two premium middle relievers (Jansen, K-Rob) so had a solid 5 SP, 6 RP mix for most of the first half. I traded a closer for a bat in June (I think) to free up an extra bench spot for hitting.
So let’s assume that you cannot devote the necessary time to get in that right quadrant. Here are three potential scenarios if one can only commit a finite amount of time to AB/IP maximization (assuming one drafted an average hitting and pitching team):
| Strategy | Estimated Impact on Standings |
| 75th percentile on AB/IP | 4.9 hit points + 5.0 pitch points = 9.9 standings points |
| 95th percentile on AB, 50th in IP | 9.1 hit points + 0.5 pitch points = 9.6 standings points |
| 50th percentile in AB, 95th in IP | 1.4 hit points + 11.5 pitch points = 12.9 standings points |
Based on the model, there is a slight advantage towards investing heaving in maximizing IP than AB. I would say that the advantages are so slight that I would base my decisions on which of hitting vs pitching has more standings points to gain.
So my bench recommendation is as follows: 1 spot reserved exclusively for RP and 2 ‘swing’ spots. On days where several teams are off, you use those two spots for hitters. If all of your hitters are active, you can use both for relief pitchers. I would draft an RP in one of those two swing spots because you never know with closer situations. Someone like Cody Allen or Victor Black could pay huge dividends between draft day and April 10th. I would avoid clogging the 2nd swing spot with a prospect (e.g., George Springer, Javier Baez, etc.) as it is doubtful any rookies will play until June.
In practice, there are more complexities. If you have a ‘hot’ bat that you want to keep in your lineup and rotate out guys who are facing a tough pitcher, you can use a ‘swing’ spot for benching a hitter. If you have a hitter dinged up for several days, use the spot. If your league is very competitive in claiming streaming starters, you may need to use one of these spots to stash someone a couple days prior to the start. Consider this just a general framework.
If you have more than 3 bench spots, you probably want to stock up on hitters and SP since the FA pool will have shrunk for both. That also gives you more freedom to stash a prospect.


