This time last year, the baseball world was predicting the downfall of Chase Field as a hitter’s haven to the tune of a 25%-50% drop in offensive production with an uptick in pitching expected to benefit from the new humidor. After a season of the new Chase Field, I wanted to review the data and see where the drop off landed.
If you’ve been following me, you know that I was a bit skeptical that we would be looking at that kind of change in production. From my Chase Field article last year, “Home runs across the league were down, away teams actually hit more home runs in Coors in 2002 than 2001, and the culture in baseball was starting to turn away from the steroid era.” Basically, Coors was used as the case study for what would happen in Arizona, but there were a number of factors that came into play outside of the raw numbers.
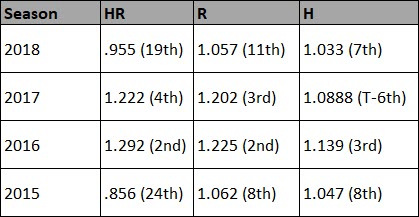
I’m not going to rehash that article, but will examine the numbers to see where Chase Field landed on the scale of hitter friendly to pitcher friendly parks. If we start with the basics, we can look at how Chase Field finished in park factors for 2018. I typically utilize FanGraphs for their park factors, but they have not updated for 2018 yet, so, I looked at ESPN. As you can see below, home runs were down in 2018 compared to 2016 and 2017, but not compared to 2015. However, runs and hits were both 4 year lows in 2018 with the humidor.

Park factors is high level, and I’m not sure what ESPN puts into their park factors. Generally speaking though, it does take about a 3 year sample to create a well-rounded park factor determination. So, yes, it would be better if we had more than 1 year of data to examine with the humidor, but this is what is available.
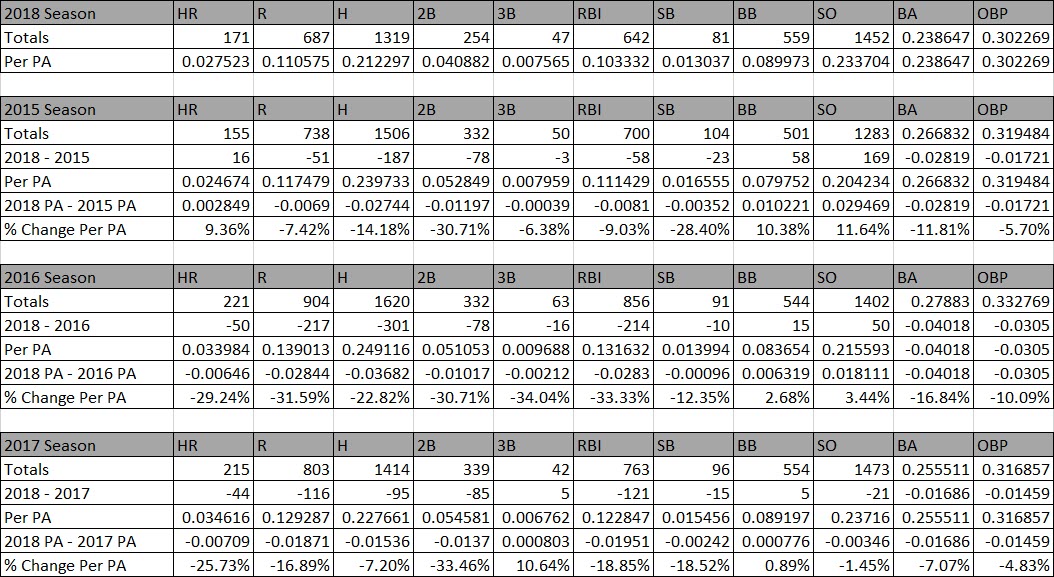
As a three-year look will contain more data, allowing us to make a more accurate projection, let’s take a look at the previous 3 years compared to 2018. For accuracy purposes, I converted the stats to per PA numbers as each season has different number of plate appearances, at bats, and games started (pinch hitters, pinch runners, pitchers hitting, etc.).

If we compare the 3 previous seasons to 2018, we can see that there is clearly an offensive drop off in 2018. If we take the average of these categories shown above, there was a 10.98% drop off in production. It’s by no means a perfect calculation, but gives us a general picture of the drop off.
I had all the data already pulled, so, I compared 2018 to each of the 3 previous seasons individually. When I examined the data, it showed that 2015 may have been an outlier season compared to 2016 and 2017 data at Chase Field. You could see this in the park factors above, but this data provides a more quantifiable difference. 2015 is the only season that had less home runs than 2018 and the offensive drop off was less significant than either 2016 or 2017. Across these categories, there was only a 7.48% fall in 2015 compared to 19.53% in 2016 and 11.13% vs 2017.

Why is 2015 different? If we look at the annual league totals (below), we can see that home runs went up significantly from 2015 to 2016. As we now know, there was a change in the baseballs used at the start of 2016, which makes the 2015 data a bit questionable as a valid comparison. However, the individual year review yielded positive results, and now we know to look at only 2016 and 2017 so that the variable of the baseballs in play is the same.

When we compare the 2-year and 3-year results, we can see that there is a difference of 11% in HR, 5% in R and RBI, but minimal change in the batting average or on base percentage.

This is a pretty limited sample of stats, but for fantasy purposes, it’s a start. The biggest change was in doubles (29.09%) and home runs (24.6%). Runs and RBI also dropped more than 20% with hits, batting average, and on base in the 7-12% range. Across these categories, we’re looking at a 13.19% change from 2018 (3-year change was 10.98%).
It will be interesting to see if these trends from the first year of the humidor at Chase Field continue. However, as with the Coors humidor, there has been a significant change in the roster that may contribute to a further drop off this season, at least for the home team. Chase Field certainly isn’t the hitter’s park that it used to be and we have to take these changes into consideration when evaluating your Diamondbacks hitters and pitchers. Hopefully, this has given you a better idea of what that production fall looks like.


