Phew, what a crazy week leading up to this year’s MLB non-waiver trade deadline. Since the addition of the second wild card to each league, more teams than ever before seem to be buyers in July, and several would-be contenders have already made significant moves in the hopes of strengthening their respective teams for a shot at October glory. Among the more prominent names involved in recent deals include Johnny Cueto, Cole Hamels, David Price, Carlos Gomez, Troy Tulowitzki, and Jonathan Papelbon. One big name player who has been involved in high profile deadline deals in each of the past two seasons is Yoenis Cespedes. With his recent trade from the Tigers to the Mets less than 24 hours ago, he’s now been traded three times in the last calendar year. What is going on here? How did he transition from a franchise cornerstone to an expendable asset in such a short period of time?
Let’s take a look at his statistics since his MLB debut in 2012:
| Season | G | PA | HR | R | RBI | SB | BB% | K% | ISO | AVG | OBP | SLG | wOBA |
|---|---|---|---|---|---|---|---|---|---|---|---|---|---|
| 2012 | 129 | 540 | 23 | 70 | 82 | 16 | 8.00% | 18.90% | 0.214 | 0.292 | 0.356 | 0.505 | 0.368 |
| 2013 | 135 | 574 | 26 | 74 | 80 | 7 | 6.40% | 23.90% | 0.202 | 0.24 | 0.294 | 0.442 | 0.318 |
| 2014 | 152 | 645 | 22 | 89 | 100 | 7 | 5.40% | 19.80% | 0.19 | 0.26 | 0.301 | 0.45 | 0.326 |
| 2015 | 101 | 422 | 17 | 60 | 58 | 3 | 4.50% | 20.40% | 0.209 | 0.289 | 0.32 | 0.497 | 0.349 |
For a power hitter who’s faced a significant learning curve from his days in Cuba to the MLB level, Cespedes has been surprisingly consistent throughout the last 3+ seasons. Low-mid 20s homers, 70+ runs, 80+ RBI, 7 steals, and a K% around 20% is roughly what he’s produced in each full MLB season. He’s proven to be a bit of a free swinger though (BB-rate has declined each season), which has been a factor in his fluctuating batting averages over the years.
Let’s see how his batted ball profile has evolved over the last few seasons:
| Season | BABIP | LD% | GB% | FB% | IFFB% | HR/FB | Soft% | Med% | Hard% |
|---|---|---|---|---|---|---|---|---|---|
| 2012 | 0.326 | 19.60% | 40.50% | 39.90% | 14.80% | 14.80% | 18.00% | 49.00% | 33.00% |
| 2013 | 0.274 | 16.70% | 37.70% | 45.60% | 14.40% | 14.40% | 18.20% | 50.10% | 31.70% |
| 2014 | 0.293 | 18.40% | 33.60% | 48.00% | 12.60% | 9.60% | 18.40% | 50.50% | 31.10% |
| 2015 | 0.328 | 21.00% | 43.20% | 35.90% | 7.10% | 15.00% | 11.70% | 53.20% | 35.10% |
Kind of a mixed bag here. Cespedes has produced a career high ground ball rate (43.2%) along with a career low fly ball rate (35.9%) thus far this season. That’s not exactly ideal for a power hitter. However, his quality of contact appears to be better than ever. His current line drive (21%) and hard hit (35.1%) percentages represent career highs, and he’s cut his infield fly ball rate almost in half from his career rate coming into the season. His soft hit percentage (11.7%) is currently the 11th lowest in MLB out of 161 qualified hitters as well. This profile seems to justify a career high BABIP (.328) that is 30 points above the current MLB average.
How has Cespedes performed as the 2015 season has progressed? Let’s take a look at his monthly splits:
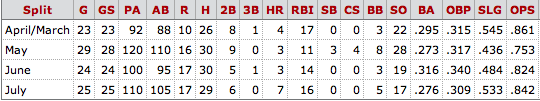
Cespedes’ consistency is evident here once again. He’s hit at least .273 with a minimum of 3 homers each month, along with double digit run and RBI totals along the way as well. The month of May stands out as being a bit unusual in that Cespedes posted his highest walk and strikeout totals, as well as logging all 7 of his steal attempts during the season in that particular month. Otherwise, there doesn’t appear to be anything that’s terribly alarming here.
What would a bear/bull post be without a player comp or two? Don’t answer that! Just take a look at the following table and judge for yourself:
| Name | G | PA | HR | R | RBI | SB | BB% | K% | ISO | AVG | OBP | SLG | wOBA |
|---|---|---|---|---|---|---|---|---|---|---|---|---|---|
| Yoenis Cespedes | 101 | 422 | 17 | 60 | 58 | 3 | 4.50% | 20.40% | 0.209 | 0.289 | 0.32 | 0.497 | 0.349 |
| Adam Jones | 89 | 377 | 15 | 49 | 45 | 3 | 4.20% | 14.90% | 0.195 | 0.286 | 0.326 | 0.482 | 0.346 |
| Jose Abreu | 94 | 403 | 16 | 57 | 57 | 0 | 5.20% | 20.30% | 0.191 | 0.296 | 0.35 | 0.487 | 0.36 |
Statistically speaking, Cespedes has performed similarly to Adam Jones and Jose Abreu, a couple of proven fantasy studs and top 15 players entering this season. According to the razzball player rater, he’s actually outperformed each of these players thus far, producing $26.7 worth of value compared to $22.7 for Abreu and $17.5 for Jones.
Finally, let’s take a look at the home/road splits for Cespedes this season:
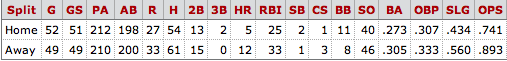
The good news is that Cespedes has been a much more effective hitter away from Comerica Park this season, and he’s produced a .375/.444/.625 triple slash line at Citi Field during his career. The fine print is that he’s only logged 9 plate appearances in his new home park. Gotta start somewhere, right?
It might surprise you to learn that Citi Field has a much more favorable park factor for home runs (1.335 – 4th in MLB) than Comerica Park (0.815 – 23rd in MLB) in 2015. That’s higher than hitter-friendly venues such as Coors Field, Yankee Stadium, and the Rogers Centre. It doesn’t hurt that three out of the Mets four division opponents were sellers at the deadline as well, leaving Cespedes to have to contend with just the Nationals staff, Jose Fernandez, and filler in divisional matchups over the next two months. Let the good times roll.
Final Verdict: