
Let’s break a bottle on this Brooklyn built ship and set sail! Before anything else, I’d like to send a huge thanks to Grey, Jay, the entire Razzball staff and all the readers for the opportunity to put my fantasy inspired madness onto digital paper. [Jay’s Note: You’re welcome!] It’s truly an honor and a pleasure, I’ve been a reader for long time. Hopefully I can provide some new information, a new perspective and some laughs to one of my favorite portions of the fantasy community. My friends, buckle up as we are about to embark together bravely on a series about an incredibly vital aspect, yet often ignored part of the fantasy game; the elusive Quality Start.
It’s fitting I guess that I’m looking for a quality start to this series about, what for many H2H points players amounts to the most vital stat on a per game basis from your starting pitcher. I refer of course, to the Quality Start and the essential 18th out. The out that makes the difference between stacking that QS with a W, creating a delicious combo meal, annihilating the scoreboard… And the most deflating stat line in a points player’s universe, the dreaded 5.2ip. There is no worse feeling or better way to ruin a night than seeing the manager waddle out to the mound, stubby arm fully extended while your guy is on the bump with two outs in the sixth (Especially with a low pitch count. Don’t get me started, I’ll start hulking out and flip the desk).
Throughout this series we will take an in-depth look at the Quality Start from a few different lenses. This first segment will aim to define the QS and put it into a statistical perspective. We’ll look at last year’s QS Leaders, their current ranking by ADP and investigate the relative importance of the stat itself. I’ll also introduce a distance metric and some MLB team stats. Later on in coming articles, (if I haven’t had my gun and badge stripped) we will attempt to measure the effect of QS on player outcomes for roto as well as points. We’ll also break down some numbers to identify players whose values are particularly changed by a format including QS. And, just for you lucky people I’ll be providing some new QS related stats I’ve developed to look for trends, anomalies and possible player progression/regression.
As far as affecting outcomes and end of year rankings, my early assumption for roto leagues is that besides higher QS numbers generally being attributed to the best overall pitchers, there is very little impact otherwise on roto outcomes (The most classical version of our beloved fantasy sport completely ignores it for a reason, mind you). Heading into this deep submersion, this thorough penetration, we will not stop until we have impregnated the essence of the Quality Start (Wait, what?).
One of the things that makes this particular stat so interesting within the fantasy multiverse is its duality. There is no other metric that is so discarded in one format, while being so desperately sought after as a league winner in another. So, based on this assumption I am also speculating the inverse to be true for points leagues; That given the general high point return for a QS (especially as a percentage return of an individual game), otherwise mediocre roto pitchers could find themselves as measurably more valuable in point leagues for their ability to get that vaunted eighteenth out. It has the ability to transform a good start into a great one, or bail one out that had too many runners without any strikeouts. I’ll dive into this deeper when we delve into the point league segment of the series.
For the purposes of this deep exploration into the uncharted fantasy jungle to study the Spotted North American Quality Start, I’d like to clarify something for the old fashioned stuffed shirt purists before we start getting down and dirty. Entering this discussion I personally maintained that the stat itself is ridiculous to even consider as a standard for any type of pitching excellence. I intended to back this assertion statistically. This is not to discount either the accomplishment or its fantasy impact completely; Every head to head point guy knows they are critical and often the determinant of the week’s winner, but on the other hand it should be recognized that the value is largely situational.
And so it begins. For any newcomers, a Quality Start is defined as a start where the starting pitcher goes at least six innings pitched and surrenders no more than three earned runs. In this worst case Quality Start (6ip, 3ER), it doesn’t take an Ivy League wunderkind to figure out that this only amounts to a 4.50 ERA. However it remains positioned as a huge part of the points game, and neglecting it is a sure path to peril.
Let’s put the great ‘’accomplishment’’ of a Quality Start into perspective statistically. I ran some 2018 MLB team stats and found the average team scored 721 runs throughout the season, or 4.45 runs per game. Right off the bat we have a simple, yet evidenced base for defining the average scoring in any game across a tremendous sample size. Keep that 4,45 runs scored per game in mind.
A 4.50 ERA obviously allows 4.50 runs per game; Hardly an outcome that provokes visions of lifting engraved trophies overflowing with the competition’s tears. Immediately we can begin to see the basis for negative bias towards the Quality Start in the roto world (see what I did there?). In fact, when compared to the established 4.45 runs per game an ERA of 4.50 actually permits 1.1% more runs than the average team even scores. So by our own terms a Quality Start is technically below average, at least as far as runs allowed (pretty important in a game decided by runs). Based solely off of these two numbers, it’s challenging at the very least to directly correlate Quality Starts to a true standard of merit. The relationship is more likely found conversely.
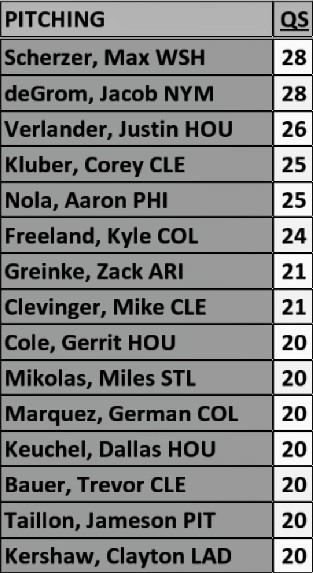
Below I’ve gathered the top starters by Quality Starts in 2018, and only 15 pitchers total were able to accumulate 20 or more (We will visit relationships to outcomes at another time). I know what you’re thinking; “John, that list basically has all of the elites on it and contradicts your point, dummy. Quality Starts make for good pitchers.” Not precisely so, my esteemed fantasy friend. I would contend in this specific case that with greatness comes the statistic, and not the other way around. I will concede that granted, distance is a positive and that getting through the sixth relieves stress on the bullpen and allows them to begin pitching a clean inning. However, these intangibles are not easily quantified and in regards to affecting roto ratios(roto-ios anyone?), one could argue that the risk to categories of leaving in a vulnerable pitcher outweighs the effect of getting a single out.
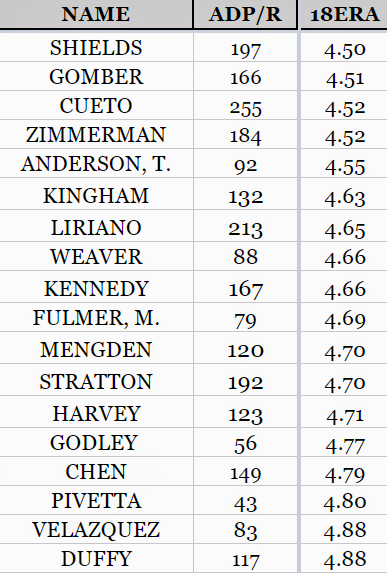
Among just over 150 qualified starting pitchers in the 2018 season, a 4.50 ERA would place that pitcher roughly at SP106 out of 153, or in the 29th percentile (which wouldn’t fly as a passing grade in a remedial class with a giant curve). I’ve attached below a snapshot of 2018 ERA results starting at 4.50, and where those pitchers are currently being position-ranked by current ADP (ADP/R). Some of the names found at or around the 4.50 ERA mark for 2018 include Antonio Senzatela, James Shields, Nick Kingham and Francisco Liriano; Not exactly inspiring, or seemingly worthy of comparison to what amounts to a huge reward in the points department. The majority of these starters will remain undrafted, or spend the season trolling the waiver wire begging to be double started. The fact that roto essentially pays no mind to quality starts seems to make a lot of sense from the run average statistical point of view. I’m going to use estimates from personal experience, but as a long time H2H player a good GS garners 20 points (roughly) with a five point bonus attached to the QS. Five points?!? What?!? That’s a 25% boost for a single out! Yes, it is. And it’s also exactly the reason for the great divide on the stat between league styles. In my humbled opinion, this round goes to the roto crowd for ignoring the QS. On the surface, Quality Starts disproportionately reward a single, arbitrary out.
So far, we’ve established that the ERA portion of a worst case Quality Start is at best average. What about the other portion? What about the distance? Imagine a pitcher who always went out and gave you a Quality Start (he can be on any team and even have a mustache if you like, providing you pronounce it moose-tache). Where would that average distance per outing place him? I quickly realized that off hand I didn’t have a go-to statistic for this. We can’t simply use innings pitched (though of course that has its own merit); Pitchers have different amounts of games started, among some other variables. I searched all the usual stalwarts, and came up empty. In my experience, rather than waste my time or be aggravated that something’s not going to be done exactly to my liking I just do it myself. So I grabbed my digital pickaxe and started mining.
I developed somewhat of a distance metric, simple but telling. I call it OPO: (O)uts (P)er (O)uting. According to 2018 OPO (147 qualified SPs), only 26 starting pitchers averaged a worst case Quality Start’s 18 outs per outing (I provide the leaderboard in OPO below). Finally, something good to be said about quality starts at their worst! Where seemingly every player on fantasy radars achieves the worst case run average for a QS (some undraftable), only 17.7% of starters average the minimum distance requirement. And just like that, in shines some light on the seemingly endless darkness we had cast… Maybe Quality Starts aren’t completely useless after all.
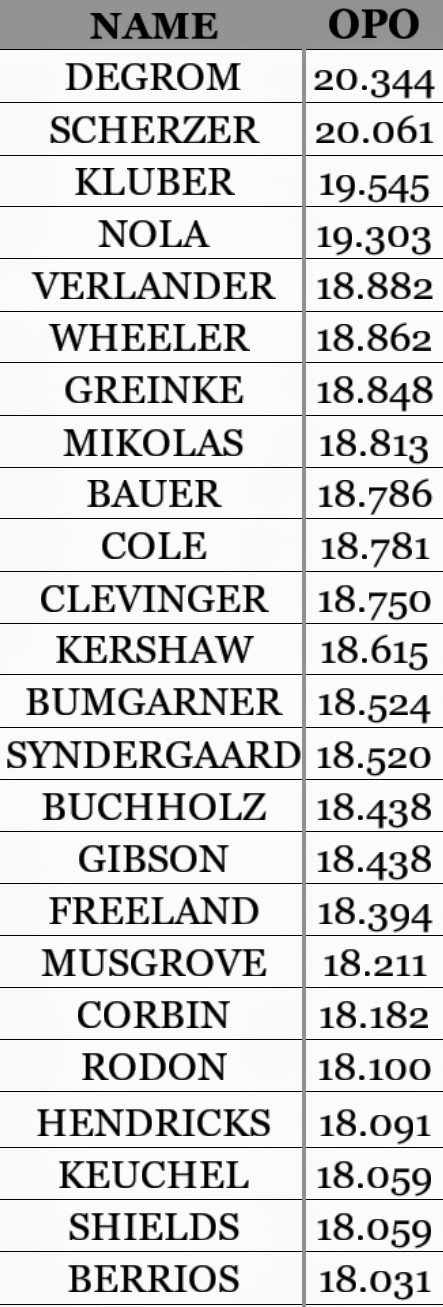
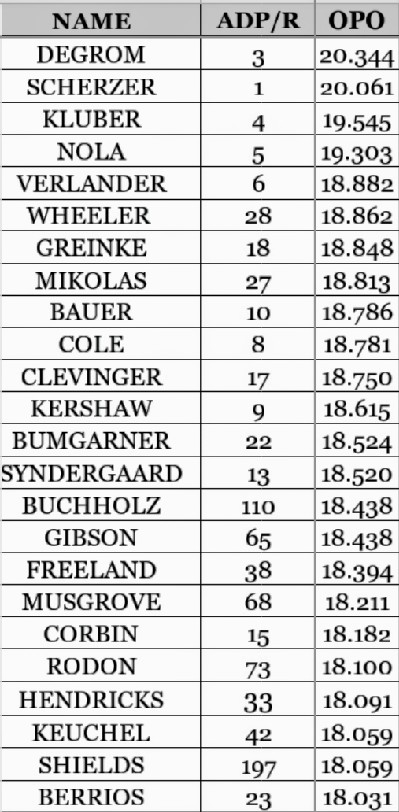
Notice the top of the list correlates to consensus position rank by current ADP (pictured below as ADP/R). This hearkens back to our earlier claim that with greatness will come Quality Starts, and with that, distance. However as we reach the bottom of the OPO leaderboard we begin to see a deviation from perceived value entering the 2019 draft (these players will be a particular focus when we examine QS value in regards to outcomes in different formats). Our initial instinct as laser-guided, value seeking missiles of course is to use this relation to sniff out those players getting us that 83%th+ percentile in distance without paying a premium. A couple of guys like Gibson, Buchholz & Rodon stand out as players that warrant a once over with the magnifying glass. In my opinion, the fact so few pitchers average 18 outs justifies a closer look at all of these and even a bump to the top of their respective blobs.
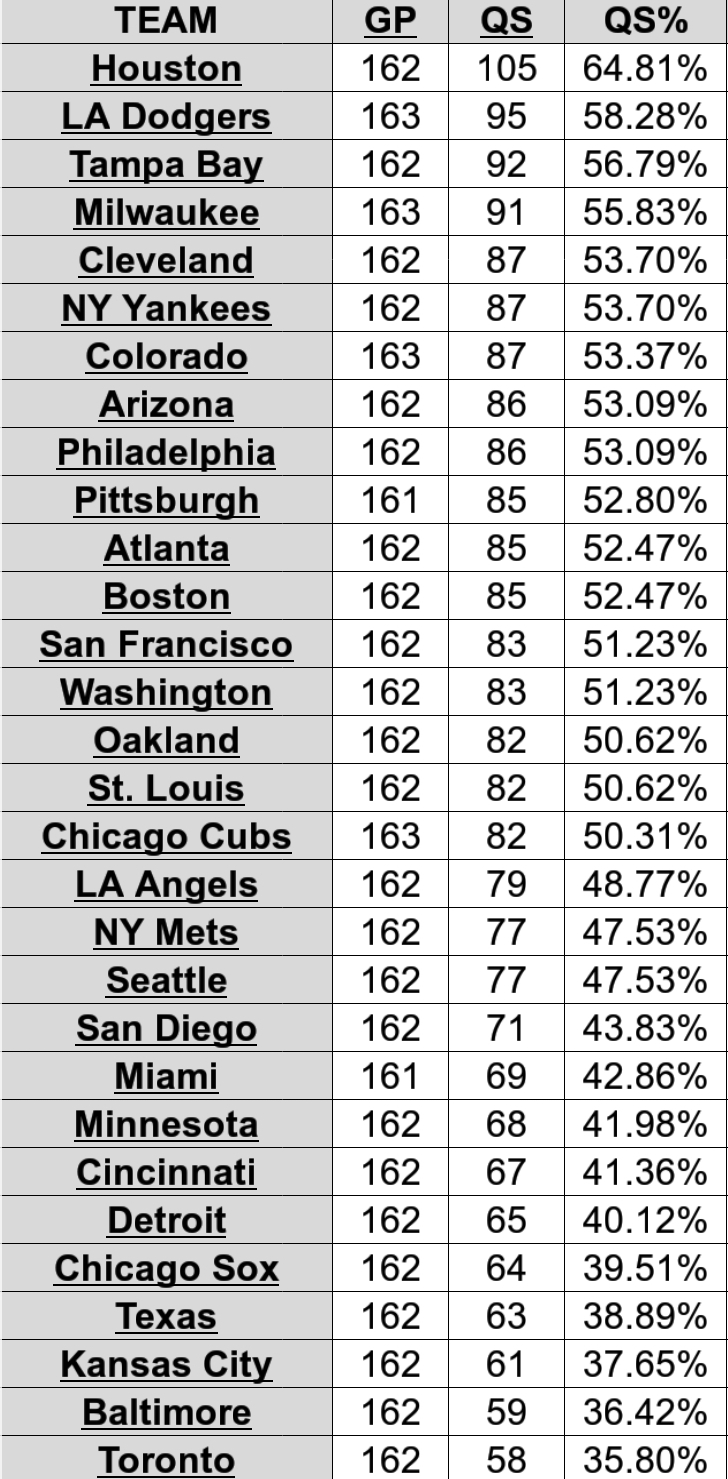
The sun is starting to set on this initial leg of our journey, but I want to take one more general snapshot of Quality Starts I shamefully never noticed before this research endeavor. I hadn’t realized how few starters got 20+ QS, nor how few starters averaged 18 outs per outing. Then it hits me like an orange Gatorade bath; I had no concept how prevalent the 2018 Quality Start even was from the broadest viewpoint. Let’s check it out before we go (I’ll leave 2018 MLB Team Leaders by QS w/QS% below as a parting gift). 30 teams start 162 games (4,860 starts). There were 2361 Quality Starts (2361 / 4860) or 48.6% of all GS are QS (the % of those converted into wins will be in a coming article). That’s it, 49%. Another very average number making it harder and harder to plant our flag, pitch a tent and maybe even skin a beaver to highlight this camp out. No such satisfaction… Yet.
So in the words of the great Teddy KGB… ”Like a young man in a for a quicky, you feel so unsatisfied”. Do not. And fear not, fellow fantasy researcher! Such is the life of the deep diver. Remember, we do not leave empty handed. We know what the Quality Start is (big whoop), which players compiled the most in 2018, along with some perspective into the QS with regards to value and scarcity. We also discovered a new distance metric and where it may provide values in regards to distance. I think we did pretty good for a first career article, don’t you? (All replies of no will be discarded to maintain 100% satisfaction rate)
Written by John L. of MLB Moving Averages. You can find more of his work on Twitter @MLBMovingAvg.