
Progress Check: We are now about 32% of the way through the season, and Memorial Day – a day people say standings start to matter – is 4 days away. The Pete Crow-Armstrong breakout is legitimate, and you’ve held onto Sandy Alcantara for too long.
Referring to a post I made back on March 15th, I wrote “have no doubt we’re only seeing the tip of the iceberg with bat speed and swing length, and with the addition of attack angle, we’ll soon have a whole new way to measure a player’s approach at the plate”. Well, here we are. Statcast by MLB went public with four new statcast metrics on May 20th, now available on Baseball Savant. The four metrics are Swing Tilt, Attack Angle, Ideal Attack Angle %, and Attack Direction.

I will leave the general explanation of these new metrics to the article linked above, but the most important takeaway here is that we now have granular data available for nearly every aspect of a batter’s approach to hitting pictured below:
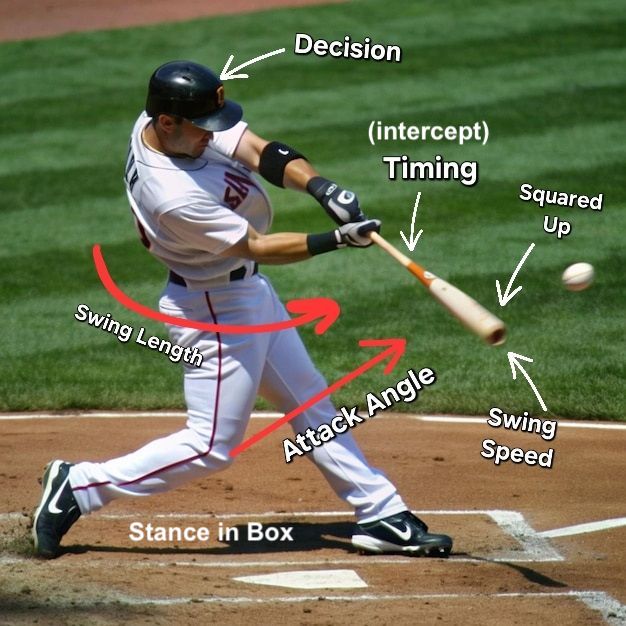
The two metrics I am going to focus on today are Attack Angle and Squared-Up %, where Attack Angle measures the direction that the bat is moving towards the ball (higher angle ? more “uppercut” swing), and Squared-Up % is the amount of times you “square-up” the ball, which is when you achieve 80% of the potential exit velocity on a pitch (based on bat speed and pitch speed). Why these two? I’m looking for the ingredients of barrels, the best quality of contact possible for a batted ball. Barreled balls have a 1.182 wOBA, non-barreled batted balls have a .284 wOBA (for 2025 season so far). How do I know the ingredients of barrels? 73% of barrels this season have had both the Ideal Attack Angle (between 5° and 20°) while also being Squared-Up.
So why look at the ingredients of barrels and not just sort by barrel rate itself? The reason is that barrels are a definitive event; they either occur or don’t, and we’re looking for leading indicators of players who may be on the verge of hitting a bunch of barrels. Perhaps they are just missing attack angle by a few degrees, or not squaring-up balls enough. Either way, if we look at the ingredients, we’re more likely to find potential hitters who maybe underrated if you only look at barrel rate.
Now let’s take this approach, but instead of looking from the hitter’s perspective, we will look at these barrel ingredients from the pitcher’s perspective. If hitting barrels are good for hitters, obviously giving up barrels are bad for pitchers. By studying who could be on the verge of hitting a bunch of barrels, we could flip the method and see who might be on the verge of giving up a bunch of barrels.
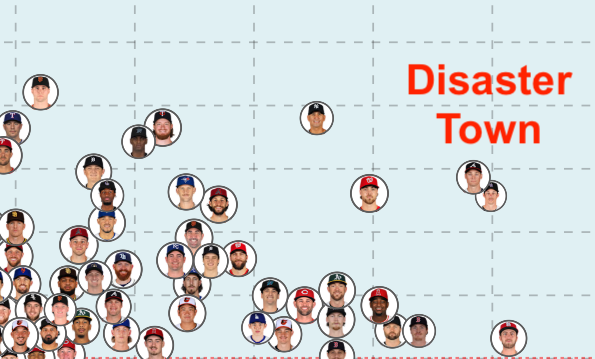
Below is the graph showing all pitchers in 2025 with 200 swings against them (almost all starters) graphed by Avg Attack Angle on swings. This isn’t a way to map out who is the best/worst starters, but it did create a nice little “map” of who is doing a good job forcing controlling contact quality against their pitches.
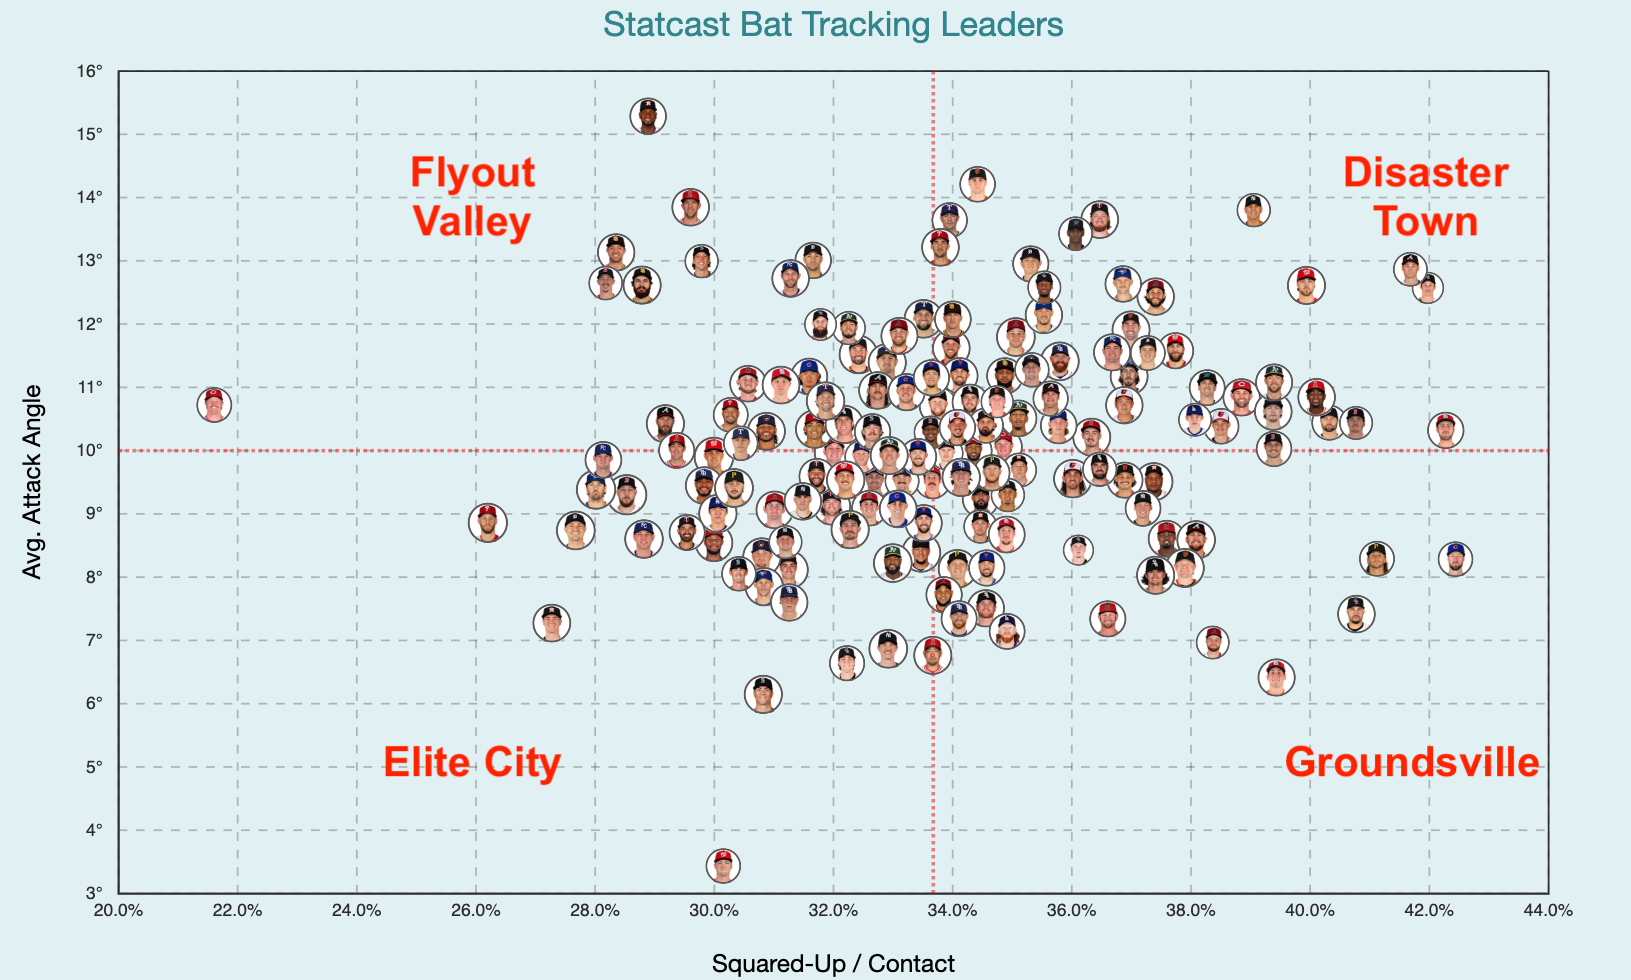
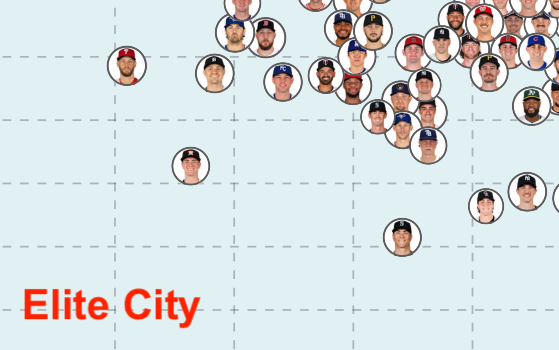
This is big chart, so I wanted to walk through by examining each quadrant. Starting with the left bottom we have Elite City, these pitchers do not get squared-up and batters have low attack angle against their pitches, All the best names are on here – Skubal, Skenes, Brown, Woo, Yamamoto, Greene, indeed, these are the studs.
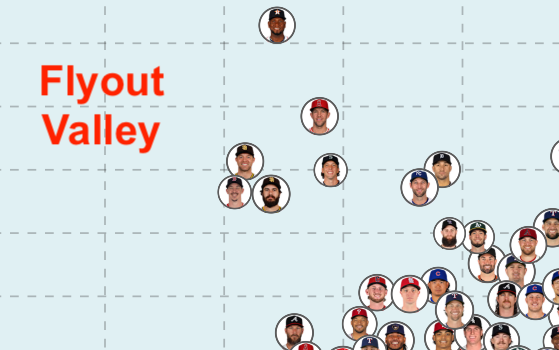
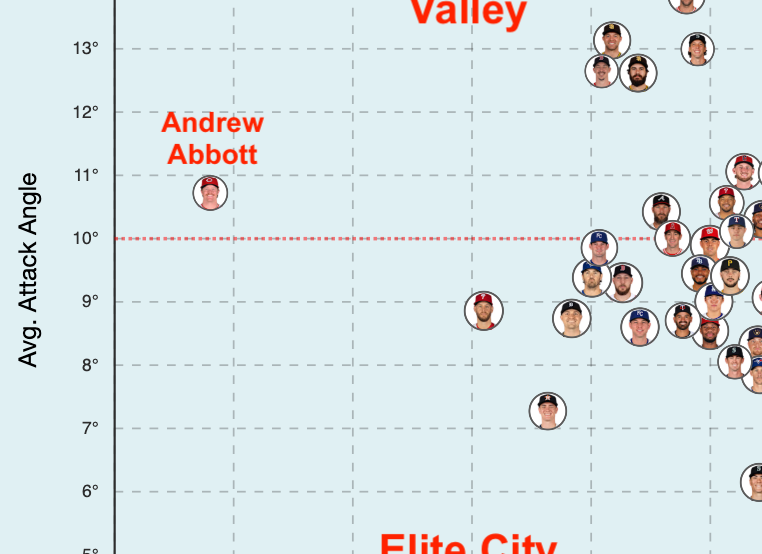
Above Elite City is Flyout Valley, these pitchers are allowing ideal attack angles (most likely hitters are timing their pitch up), but for some reason, their pitches aren’t getting Squared-Up. These are guys who have had some good/bad starts like Wacha, King, Cease, Buehler, Bibee, and Tyler Anderson.
To the right bottom is Groundsville, where you see pitchers who often allow hard hit ground balls. Pitchers are failing to get to the ideal attack angle even though the pitches are being squared-up. Noted contact specialist Logan Webb is joined by good names like Dustin May, Spencer Schwellenbach, Andre Pallante, with some suspect names like Colin Rea, Antonio Senzatela.

Finally we get to the right-top quadrant, pitchers who are getting both squared-up and at a good attack angle. We’ll call this Disaster Town. Included in this picture are pitchers who have been in the middle of multiple disasters like Tanner Houck and Aaron Nola, and non-reputable names like Bryce Elder, Cal Quantrill, and Carlos Carrasco.
Some names I was surprised by their location on the map:
- Chad Patrick, Chase Dollander, Emerson Hancock, and Clarke Schmidt hanging out in Elite Town
- Matthew Liberatore having a below average barrel rate allowed despite allowing one of the highest squared-up rate and allowing an average attack angle
- AJ Smith-Shawver appearing to be the mayor of Disaster Town despite having a 2.33 ERA
Finally, I have to acknowledge the man living in his own zipcode. Andrew Abbott on the very left exists in his own tier, and here is a great breakdown of Andrew Abbott from Fangraphs and how he’s been the hardest pitcher to square-up in baseball.
Note: If you want to play around with this map yourself you can access below: