
Progress Check: We’re now about 23% of the way through the season, and Memorial Day – a day people say standings start to matter – is 18 days away. The point has come where we can’t simply dismiss 6 week long struggles as flukes, and 6 week long breakouts as hot streaks. Statements like “Tanner Bibee will be fine” give way to “What’s going on with Tanner Bibee?” and statements like “Pete Crow-Armstrong, the guy without eyebrows?” give way to “How did I miss out on Pete Crow-Armstrong?”.
To distinguish mere hot starts from real deals, we often rely on indicators of a player being “lucky” using stats like BABIP and FIP. However, in the case of BABIP it does not stabilize until 2000 balls in play, and FIP may not indicate true ERA for certain pitchers, no matter the sample size. This is where I want to introduce the second-order differential of luck.
In mathematics, a first-order differential equation is a formula that shows the rate of change, whereas the second-order differential equation shows the rate that the rate of change is changing. A common example used to illustrate this is velocity; Velocity is the rate you’re moving (Distance ÷ Time), and the second-order differential of velocity is Acceleration, which is how much your Velocity is changing over time (Distance ÷ Time divided by Time again). Going back to baseball, if BABIP was the first-order differential of Batting Average, what would be the second-order differential of BABIP?
If you’re reading a Stat Chat blog, you’re likely already familiar with xBA, the statistic produced by Statcast that calculates the expected batting average based on factors like exit velocity and launch angle of batted balls. Now, if we calculate the xBA of batted ball events, that would give us xBA for only balls in play, which we can call xBABIP, the second-order differential of BABIP. To show this new metric in use, let’s compare batters who have been lucky (high BABIP), batters who have been unlucky (low BABIP), and see within those groups who have been deservedly lucky (high BABIP with high xBABIP), and who have been deservedly unlucky (low BABIP with low xBABIP).
First, here is the table of players with the highest and lowest BABIP:
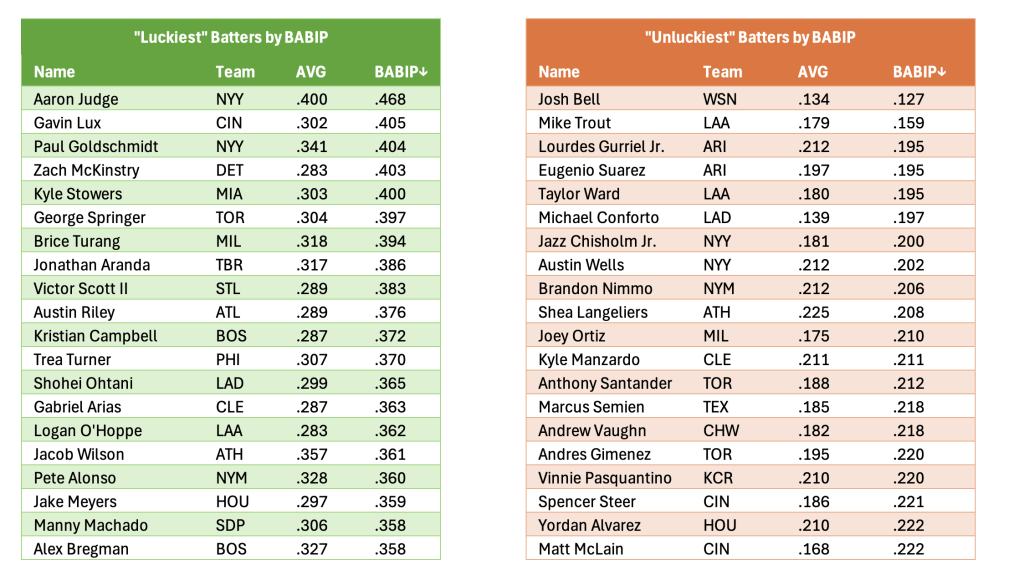
Right away we see Aaron Judge who hits the crap out of the ball on one side, and Josh Bell who doinks grounders into the ground on the other side, but given that the league wide BABIP in 2025 is .289, we can suspect that there is some overperformance on the players in the green table, and the opposite occurring for Team Orange. Now, to investigate how much of this over/under performance is occurring, we layer in the xBABIP statistic and sort both tables by the difference between current BABIP and xBABIP:
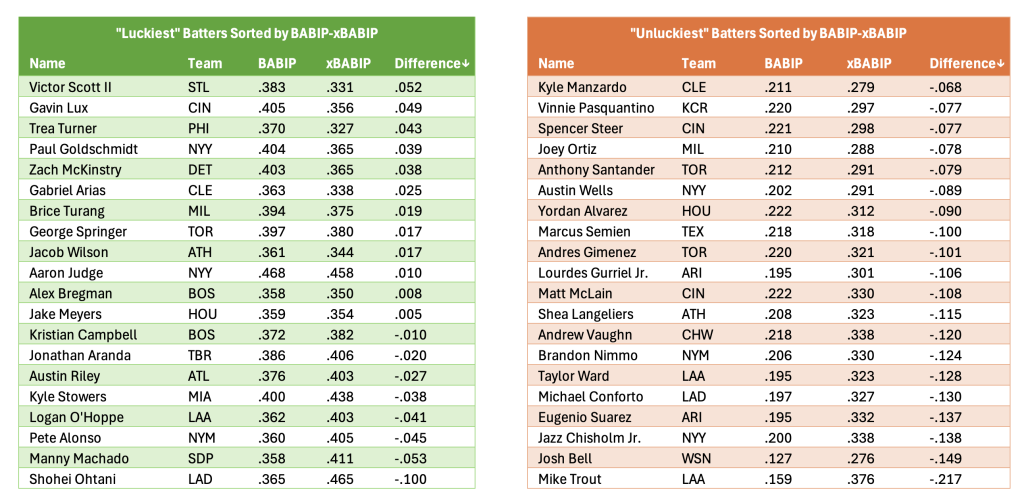
This table shows two things, first is that speed plays an element in BABIP. Speedsters showing at the top of the green table is somewhat expected, since they can beat out infield singles, which will lower xBABIP but still count as hits, and the opposite can be said for slow players like Manzardo and Pasquantino on the orange table. So, in some ways, we can say players like Kyle Manzardo and Vinnie Pasquantino have been “unlucky” because of low BABIP, but you can see the xBABIP doesn’t say that it should be that high to begin with (just look at Mike Trout for comparison).
Ultimately, these type of dissections of underlying indicators will be more commonplace as we begin layering in “Batting+” style metrics that I discussed in my previous post here.