
In my previous post two weeks ago I introduced the concept of tracking Squared-Up Rate against Attack Angle to measure the quality of contact. Included in the post was the roadmap of SPs showing which town they lived in:
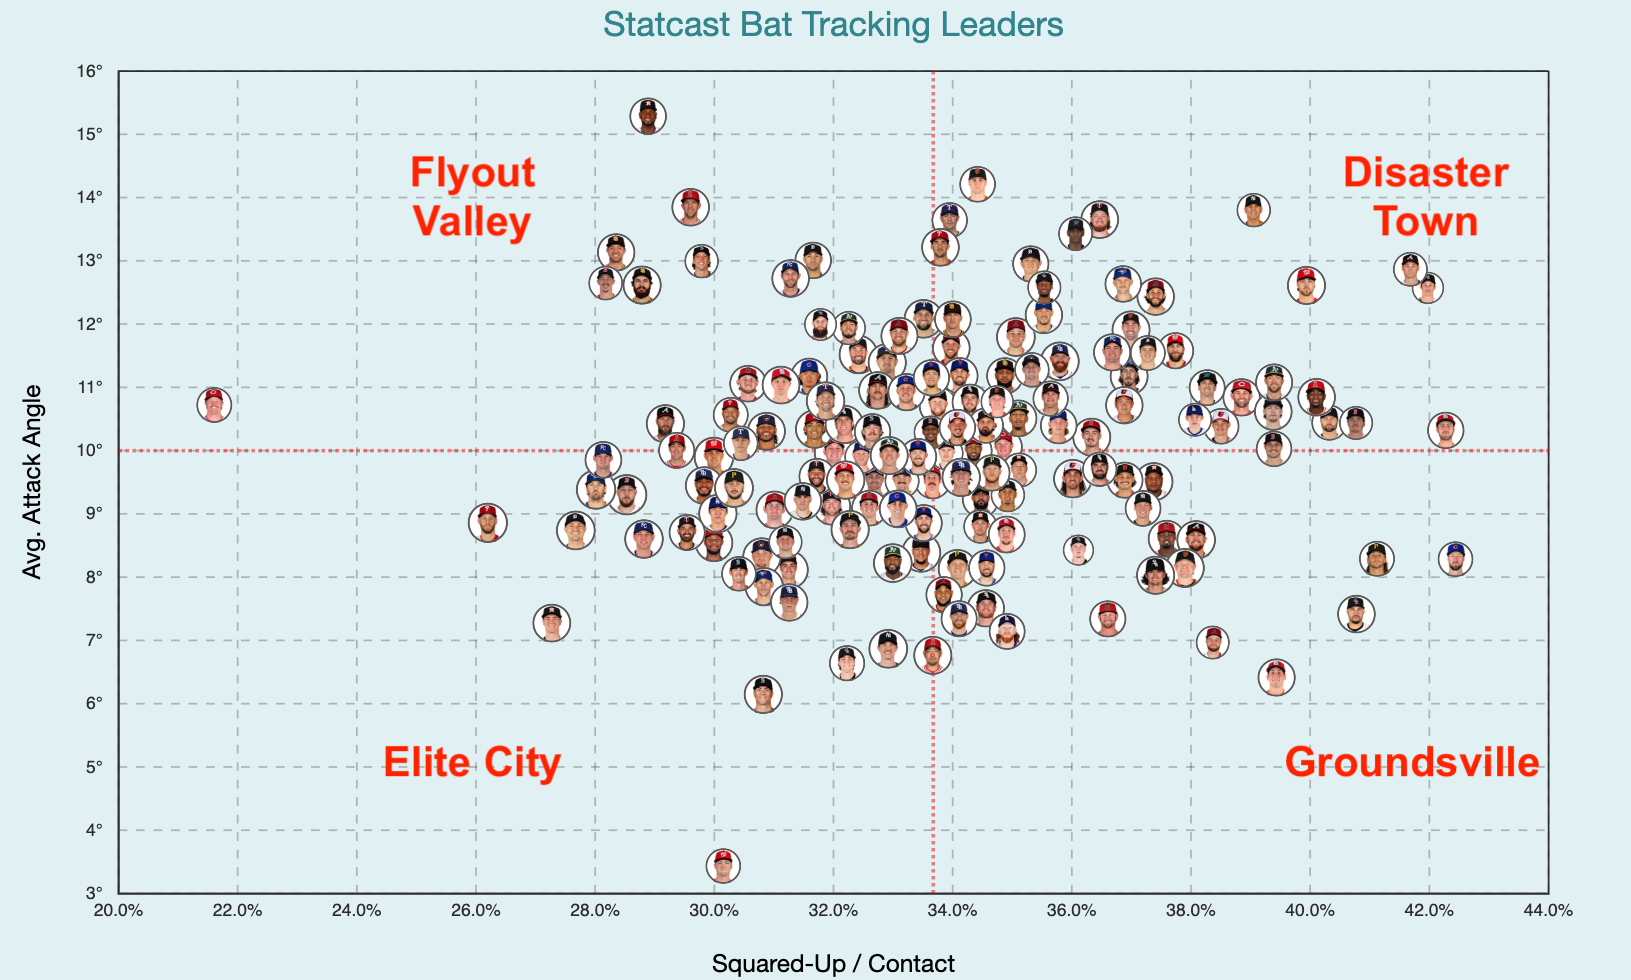
In the two weeks since, we’ve seen Disaster Town residents have bad starts (Jose Soriano, Max Meyer, AJ Smith-Shawver) and surprising Elite City residents continue to perform (Chad Patrick, Clarke Schmidt, Emerson Hancock). A couple of thoughts come to mind regarding why measuring these metrics have proven to be predictive (so far):
- Attack Angle is effectively a metric of timing (and less of how much your “uppercutting” or “down chopping”). Remember, your bat is always swinging down or swinging up at any point during a swing, and Attack Angle is simply a measure of what your bat was doing when it made contact with the baseball. Here’s an example showing how Connor Norby’s swing is attacking at a -3° angle before contact, but rises to 19° by the time contact is made (this is when the angle is actually measured).
- This means if a pitcher is consistently getting bad attack angles from hitters (too high or too low), it essentially signals that their pitches are not getting “timed up”. So by measuring attack angle against squared-up / contact, we’re looking for pitchers who are both hard to time up AND hard to square-up.
- When it comes to hitters, it’s been hard to correlate stuff like Attack Angle to show success on a single batter basis, but that is because which attack angle is successful varies widely from hitter-to-hitter, based on their point of intercept and bat speed. However, by looking at attack angle for pitchers, we essentially normalize for those factors because pitchers are facing 100s of hitters with different bat speeds and intercepts.
- This method has proven to be a pretty good proxy for measuring the quality of contact hitters are making, but this obviously leaves a huge hole to add in swing-and-miss pitchers to create a combined leaderboard.

To fold in the swing-and-miss factor, I’m going to add K-BB% the gold standard predictive measure used to assess how much a pitcher gets strikes, and avoids walking extra runners:
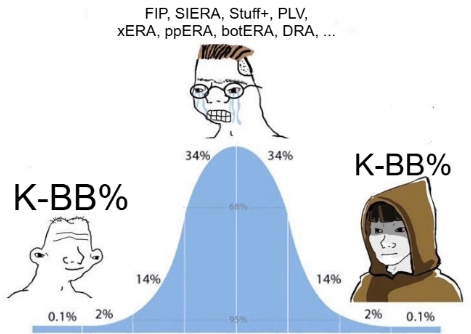
Cavemen and SABR 9.0 nerds know it comes down to K-BB%
In order to normalize the road map seen at the top and turn it into a single metric, I’m going to take the average of percentile rank of Attack Angle vs Squared-Up / Contact and calling it Quality of Contact score, and then comparing it against the K-BB% percentile to create an overall ranking called Overall Score. I also added in the OOPSY projected rest-of-season ERA just to see what pitchers my system likes that OOPSY does not like (and vice versa). Here are the top pitchers based on this new scoring system:
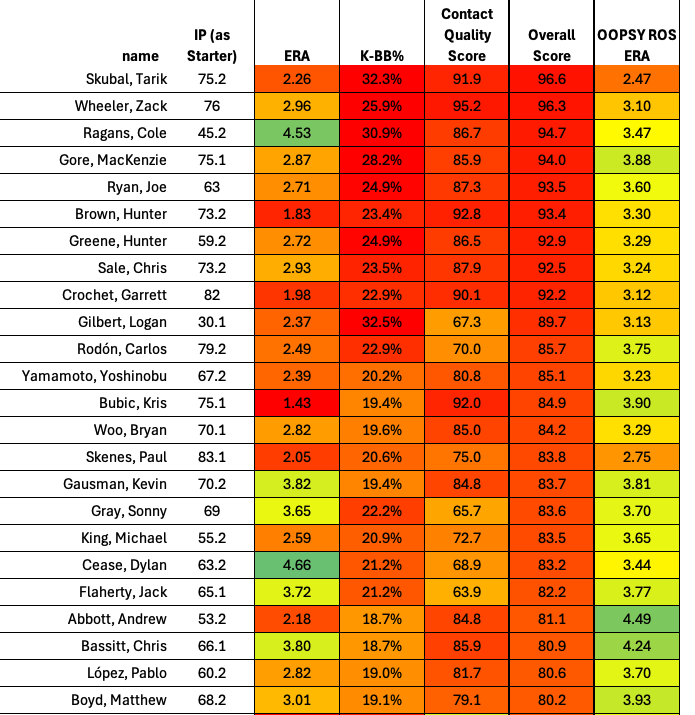
I’m quite pleased with how this ranking looks. Elevating guys with lower K-BB% like Yoshinobu Yamamoto and Bryan Woo above guys like Jack Flaherty and Dylan Cease due to their elite quality of contact, and also recognizing Andrew Abbott and Chris Bassitt towards the top were the goals, and this ranking certainly accomplished that. Right away looking at the OOPSY ROS ERA on the right you see some discrepancies, and also a big projected real life ERA bounce back for Cole Ragans (although OOPSY agrees with that too).
Here are the bigger disagreements comparing OOPSY projected ROS against this system.
Pitchers OOPSY does not like that I do:
- Ryan Yarbrough
-
-
- Current ERA: 2.08
- OOPSY ROS ERA: 4.29
- My Estimated ERA (MyERA): 3.46
-
- Chad Patrick
-
-
- ERA: 2.73
- OOPSY: 4.16
- MyERA: 3.60
-
- Eduardo Rodriguez
-
-
- ERA: 7.05
- OOPSY: 4.40
- MyERA: 3.65
-
- Walker Beuhler
-
-
- ERA: 4.44
- OOPSY: 4.66
- MyERA: 3.74
-
Pitchers OOPSY likes that I don’t:
- Clay Holmes
-
-
- ERA: 3.07
- OOPSY: 3.44
- MyERA: 4.11
-
- Kodai Senga
-
-
- ERA: 1.60
- OOPSY: 3.66
- MyERA: 4.00
-
- Bryce Miller
-
-
- ERA: 5.36
- OOPSY: 4.15
- MyERA: 4.79
-
- Luis Castillo
-
-
- ERA: 4.54
- OOPSY: 4.11
- MyERA: 4.24
-
- Justin Verlander
-
-
- ERA: 4.33
- OOPSY: 4.10
- MyERA: 4.54
-
If I were to distill the 1600 words I’ve posted in these two articles and plant some flags, it’s basically this:
I’m buying in on Cole Ragans and Chad Patrick, and fading Clay Holmes and Kodai Senga.