
The Upton brothers are starting their second year as teammates…and it hasn’t been a pretty sight so far: B.J. Upton became a giant train wreck and Justin Upton’s average and stolen bases fell out from under him. I’m dedicating this article to Justin. Maybe I’ll give Bossman Junior a look-see some other time. But don’t get your hopes up, he isn’t as interesting as his little bro.
Category One: Injury Risk
In general, Jupton is a fairly healthy dude: he has played in at least 130 games every season since 2009. Over the five seasons between 2009 and 2013 he has topped 145 games three times. And those three seasons are the most recent ones. You know what… I’ll just throw up a line graph to show you, it’s easier for both of us:
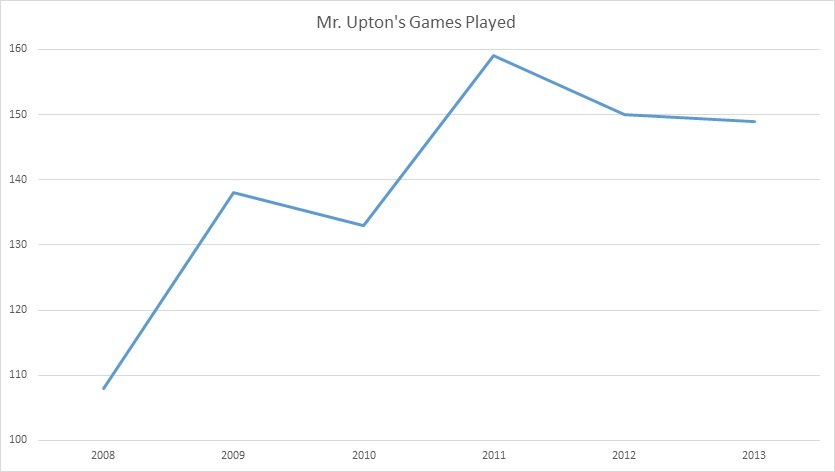
Justin has been getting better at avoiding the DL. Since 2008, his first full season, he has only had two DL stints. These occurred in 2008 and 2009. In 2014, Upton has played in forty of forty-two games this season. If you extrapolate this to a full season, he should be expected to play in 154.29 games. That’s right, you should expect 29% of Justin Upton to come out to play a game sometime this season.
Now for a quick peek into Upton’s specific injuries. Justin has a long history of missing games here and there. Guess what? More graphs:
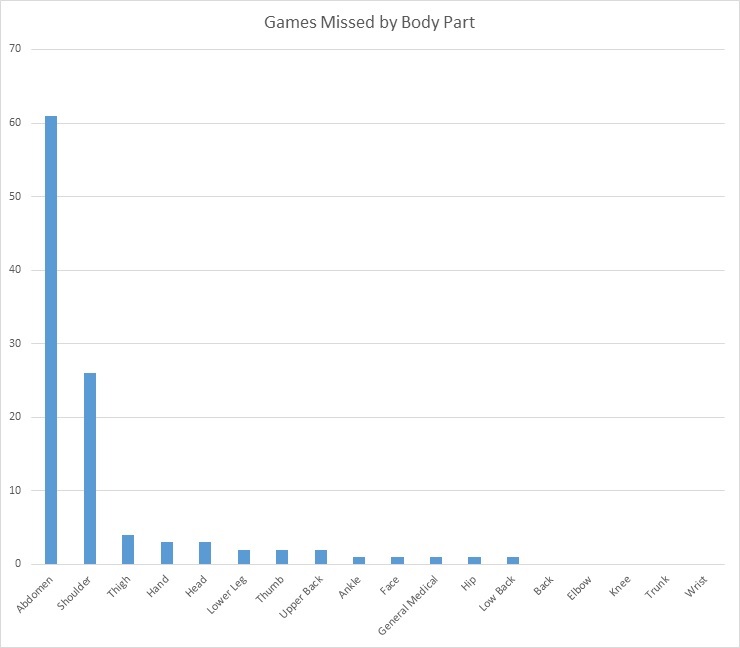
Upton has basically injured every part of his body. Most of the time these injuries were minor though, Day-to-Day issues at worst. The abdomen issues were the cause of both his DL stints, and his abdomen hasn’t been an issue since then. Upton had a nagging shoulder issue in 2010, but again, it hasn’t been re-aggravated.
Unless something drastic happens, Upton is a lock for 150 games.
Score: 4 out of 5
Category Two: Everything Else
First, I’ll start out with something simple that I bring up in most of my analyses: AVG and BABIP. Upton is a career 0.275 hitter. This year he is hitting 0.279. His career BABIP is 0.333, and this year he is showing a 0.360 BABIP. If the season ended today, that 0.360 would be tied for his highest BABIP, in 2009. He hit 0.300 that year. In general, Chase Field (Diamondbacks’ Stadium) is a hitter’s ballpark whereas Turner Field (Braves’ Stadium) is much closer to a neutral ballpark. But I wouldn’t say the differences are that staggering in terms of park factors.
| Field | G | AVG | BABIP |
|---|---|---|---|
| Chase Field | 367 | 0.308 | 0.362 |
| Turner Field | 110 | 0.286 | 0.364 |
The chart above shows how Justin has hit at each stadium. His average is about 0.022 higher when he was in Arizona than in Georgia. The interesting part is the BABIP though. He was able to sustain this higher batting average with a lower overall BABIP. This doesn’t bode well for Upton.
To try to figure out what’s going on, I’m going to look into Upton’s contact and swing rates. In general, there is nothing special about Upton’s swing rate. The only difference so far in his swing rate this year is that he is swinging at an abnormally high amount of pitches inside the strike zone. This is a good thing of course, because he is more likely to make contact on these pitches.
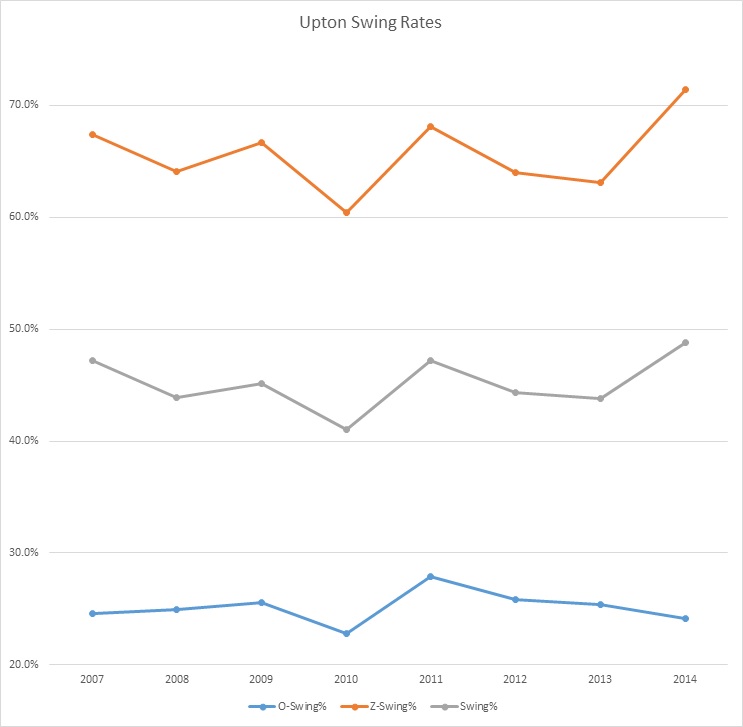
O-Swing% is how often he swings at pitches outside the zone, while Z-Swing% is for pitches inside the zone. The grey line in the middle is the overall swing rate, which is fairly steady. Next up is contact rate:
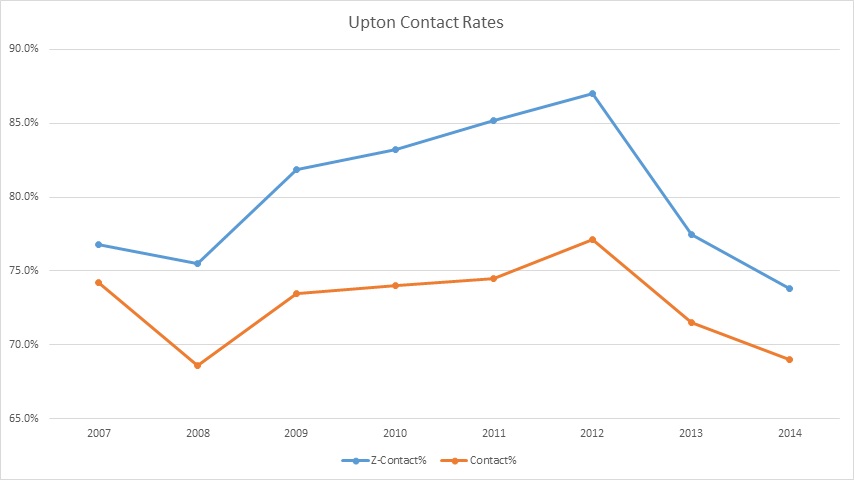
I left off outside zone contact rates because there was nothing interesting there. Upton’s contact rate is way down both inside the zone (Z-Contact%) and overall. If I remove all seasons with fewer than 130 games(2007 and 2008), the graph looks like this:

Everything was looking up for Justin during his time in Arizona, then it fell apart in Georgia. Upton is having trouble making contact ever since his move. Looks like the D-backs made the right call in trading him, although that was probably based on payroll.
Next I want to look at Upton’s strikeout rates:
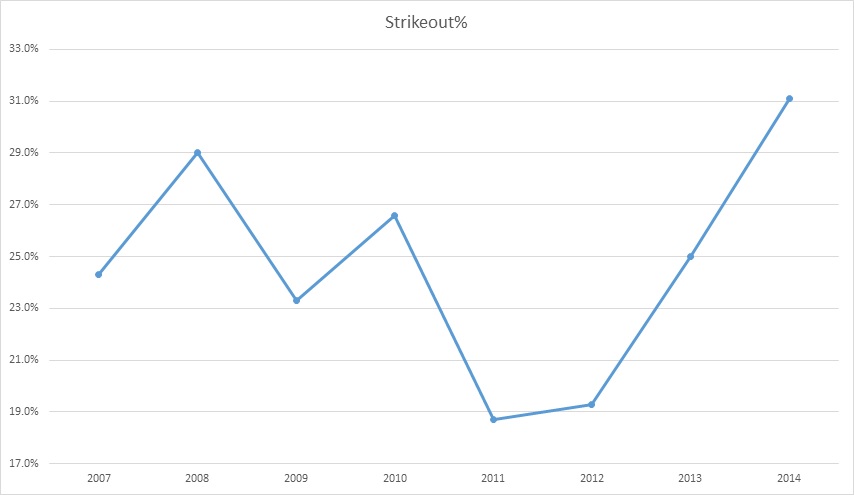
Again things don’t look great. Power hitters tend to have higher strikeout rates, but thing were heading in the correct direction for Justin until 2013. He has seen a huge spike in strikeouts in Atlanta. This year he is near one strikeout for every three plate appearances. These strikeouts probably account for a decent amount of the downturn in contact made, and eventually they will catch up to him.
The next metric I delved into was batted ball distance. This metric shows how far Justin was hitting his fly-balls and home runs on average.
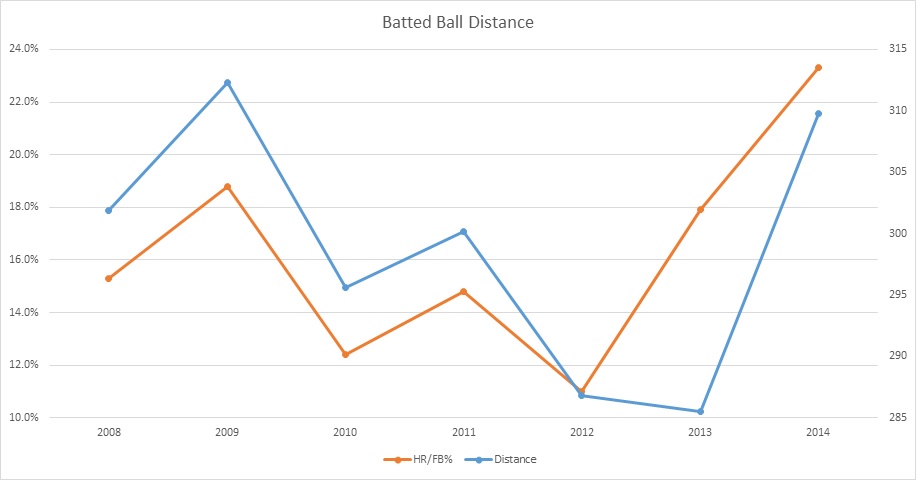
I also included HR/FB% on this graph since they are correlated. This shows that Upton had been slowly losing power until this year. It is unfair to include this year though, as he got off to a hot start and has ten homers in forty games. The biggest red flag in this graph is from 2013. Upton hit seventeen homers in 2012 and twenty-seven in 2013, but his batted ball distance went down from 2012 to 2013. This means that those twenty-seven homers were a major fluke. Expect major regression in the dinger department.
The last thing I looked at was Upton’s monthly splits.
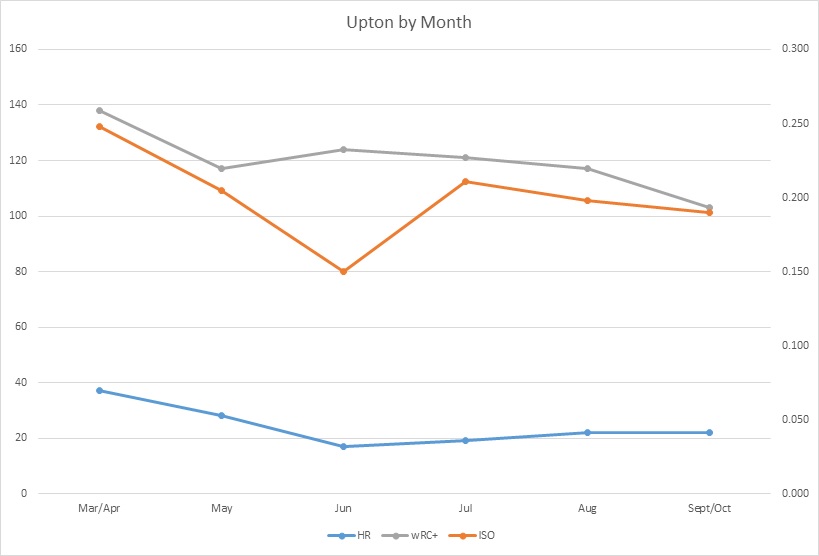
I was mainly looking at Upton’s power by month, and the results don’t look great. April is Upton’s biggest month, by a fair margin (wRC+ is an overall offensive metric). You can also see that April and May tend to be the months where Upton has the highest ISO and HR totals. Upton hit twelve homers in April of 2013. He then hit four homers between May, June, and July that year.
I think Upton has been getting lucky this year. I wouldn’t expect for the good times to keep rolling.
Score: 5 out of 15
Overall Score: 9 out of 20
Weighted Score: 90%
Upton Girl? More like Downton Girl.
Jeremy is a contributor for Razzball Baseball. He had a last name, but he lost it in ‘Nam. You can follow the soldier of misfortune on twitter @Jeremy_Razzball, just don’t trigger his flashbacks.