Professionally speaking, 2015 has not been a good year for Matt Kemp. Actually, Kemp’s woes might have started last December when his former team, the Los Angeles Dodgers, agreed to trade him to division rival and current team, the San Diego Padres. Is there a bigger slap in the face in professional sports than when a team decides to move a player within it’s own division? The Dodgers even kicked in $32 million in cash in order to complete the transaction. Not only did the Dodgers seem unconcerned about having to face Kemp on a regular basis in the near future, but they paid down a significant portion of his salary to make it happen. It’s like breaking up with a long-time girlfriend while treating her like a one night stand. “Yeah, I have this thing to do right now, so I’ll have to ask you to leave. Here’s some cab fare for you on the way out. Have a nice life.” That’s just cold!
As I’ve already mentioned, Kemp hasn’t performed at his highest level in his first season with the Padres. Let’s take a look at his numbers over the past five seasons to see how this year stacks up:
| Season | G | PA | HR | R | RBI | SB | BB% | K% | ISO | BABIP | AVG | OBP | SLG |
|---|---|---|---|---|---|---|---|---|---|---|---|---|---|
| 2011 | 161 | 689 | 39 | 115 | 126 | 40 | 10.70% | 23.10% | 0.262 | 0.38 | 0.324 | 0.399 | 0.586 |
| 2012 | 106 | 449 | 23 | 74 | 69 | 9 | 8.90% | 22.90% | 0.236 | 0.354 | 0.303 | 0.367 | 0.538 |
| 2013 | 73 | 290 | 6 | 35 | 33 | 9 | 7.60% | 26.20% | 0.125 | 0.353 | 0.27 | 0.328 | 0.395 |
| 2014 | 150 | 599 | 25 | 77 | 89 | 8 | 8.70% | 24.20% | 0.22 | 0.345 | 0.287 | 0.346 | 0.506 |
| 2015 | 93 | 389 | 10 | 46 | 52 | 8 | 5.10% | 23.90% | 0.15 | 0.314 | 0.256 | 0.301 | 0.406 |
The good: Kemp is just 2 steals shy of producing his best mark in that category since 2011. His K-rate is the lowest it’s been since 2012. He’s currently on pace for 81 runs scored and 91 RBI, which would surpass his totals in those categories in each of the past three seasons.
The bad: Everything else. Kemp’s power is on the decline, and his current 5.1% BB% would be his lowest walk rate since the ’07 season. Comparing his ’15 stats to those from his MVP-caliber ’11 season is like comparing a juicy ribeye steak to a Big Mac. Kinda depressing actually.
Let’s take a look at Kemp’s batted ball data to see how those results have been trending:
| Season | GB/FB | LD% | GB% | FB% | IFFB% | HR/FB | Soft% | Med% | Hard% |
|---|---|---|---|---|---|---|---|---|---|
| 2011 | 0.9 | 23.20% | 36.30% | 40.50% | 2.20% | 21.40% | 16.20% | 50.90% | 32.90% |
| 2012 | 1.24 | 21.80% | 43.20% | 35.00% | 2.80% | 21.70% | 8.30% | 54.50% | 37.30% |
| 2013 | 1.15 | 25.30% | 40.00% | 34.70% | 4.50% | 9.10% | 8.40% | 55.80% | 35.80% |
| 2014 | 1.38 | 25.90% | 43.00% | 31.10% | 0.80% | 20.00% | 8.00% | 51.70% | 40.30% |
| 2015 | 1.47 | 22.50% | 46.10% | 31.40% | 1.20% | 11.80% | 11.10% | 50.60% | 38.40% |
Kemp’s quality of contact remains largely unchanged this season. In recent years, he’s typically been among the league leaders in terms of highest hard hit percentage and lowest infield fly ball percentage, and this season is no different. His ground ball to fly ball ratio is trending in the wrong direction for a power hitter though, and his current 11.8% home run to fly ball ratio reflects a combination of his new pitcher-friendly home ballpark and his declining power as he advances into his thirties.
How has Kemp adjusted to his new environment in San Diego as the season has progressed? Let’s take a look at his monthly splits in 2015:
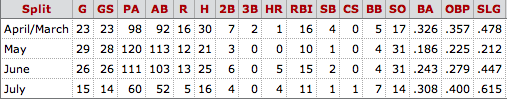
The month of May was certainly brutal for Kemp, wasn’t it? A 186/.225/.212 triple slash line? Yikes. But Kemp has started to turn things around recently. He’s hit 9 of his 10 home runs this season since the calendar turned to June, and over the last 30 days, his hard hit % (45.0% – 6th in MLB) and ISO (.305 – 7th in MLB) are among the best in baseball. His BB/K ratio seems to be trending in the right direction too.
A look at Kemp’s 2014 1st/2nd half splits shows that it’s not unusual for him to heat up as the season progresses:

While it’s true that Petco Park has a reputation as a pitcher’s park, it might surprise you to learn that it has the 5th highest park factor in MLB for home runs in 2015, ahead of hitter-friendly venues such as the Toronto’s Rogers Centre (8th) and Colorado’s Coors Field (9th). Dodger Stadium currently ranks 11th on that list.
Let’s take a quick look at Kemp’s home/road splits to see how he’s handling his new environment:
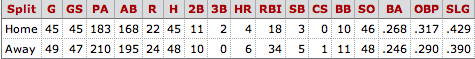
As you can see, Kemp has actually performed better at Petco than away from home this season. There don’t appear to be any legitimate reasons to expect his offensive numbers to be negatively affected by his home ballpark going forward.
Although Kemp got off to a slow start with his new team this season, he seems to be on the right track recently. Recent history suggests that he heats up with the weather and becomes more productive as the season progresses. Don’t be scared off by his first two months – if anything, it might allow you to acquire a #2 OF at a #4 price.
Final Verdict: