What is Hittertron?
Hittertron is the ultimate tool for identifing attractive short-term hitter pickups (aka streaming hitters) and to determine when to start/sit hitters on your roster. There are Daily and Weekly versions for both Roto and Points leagues as well as Monday-Thursday and Friday-Sunday for Roto (mirroring NFBC rules).
Daily (Roto) 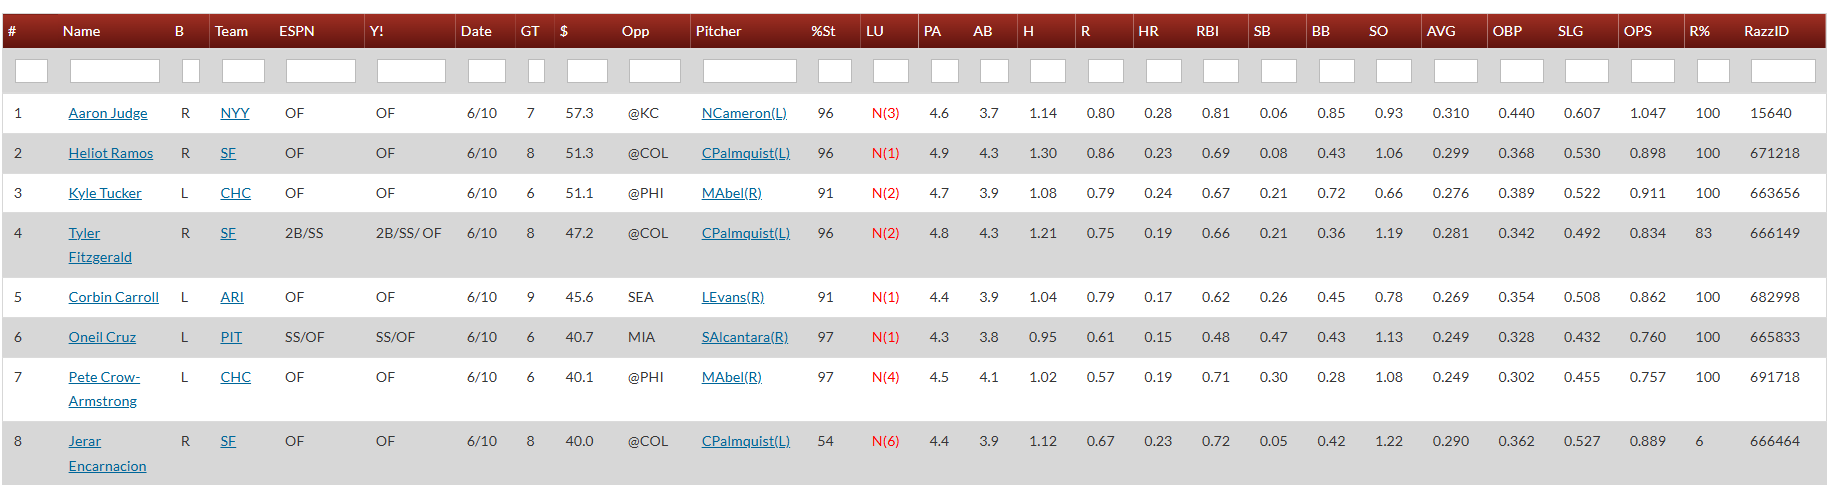
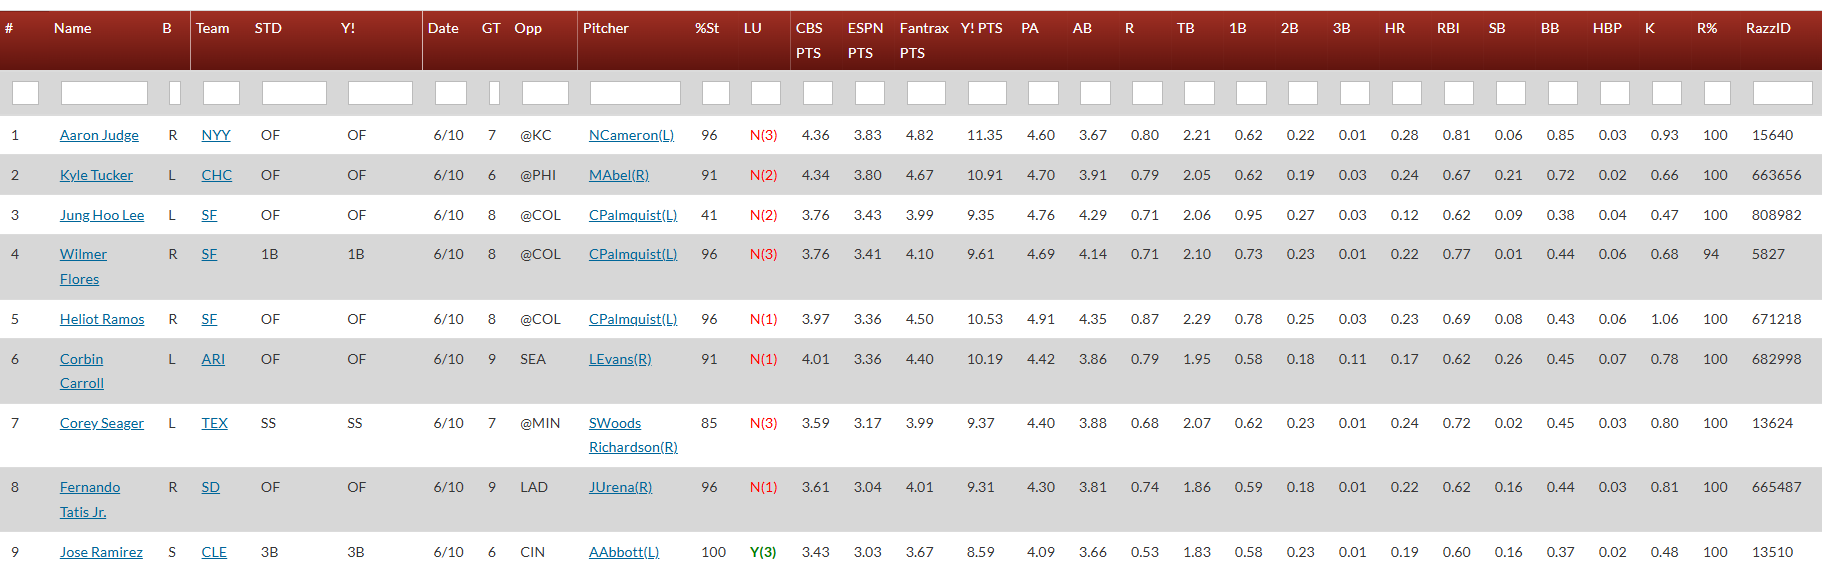
Daily (Points)
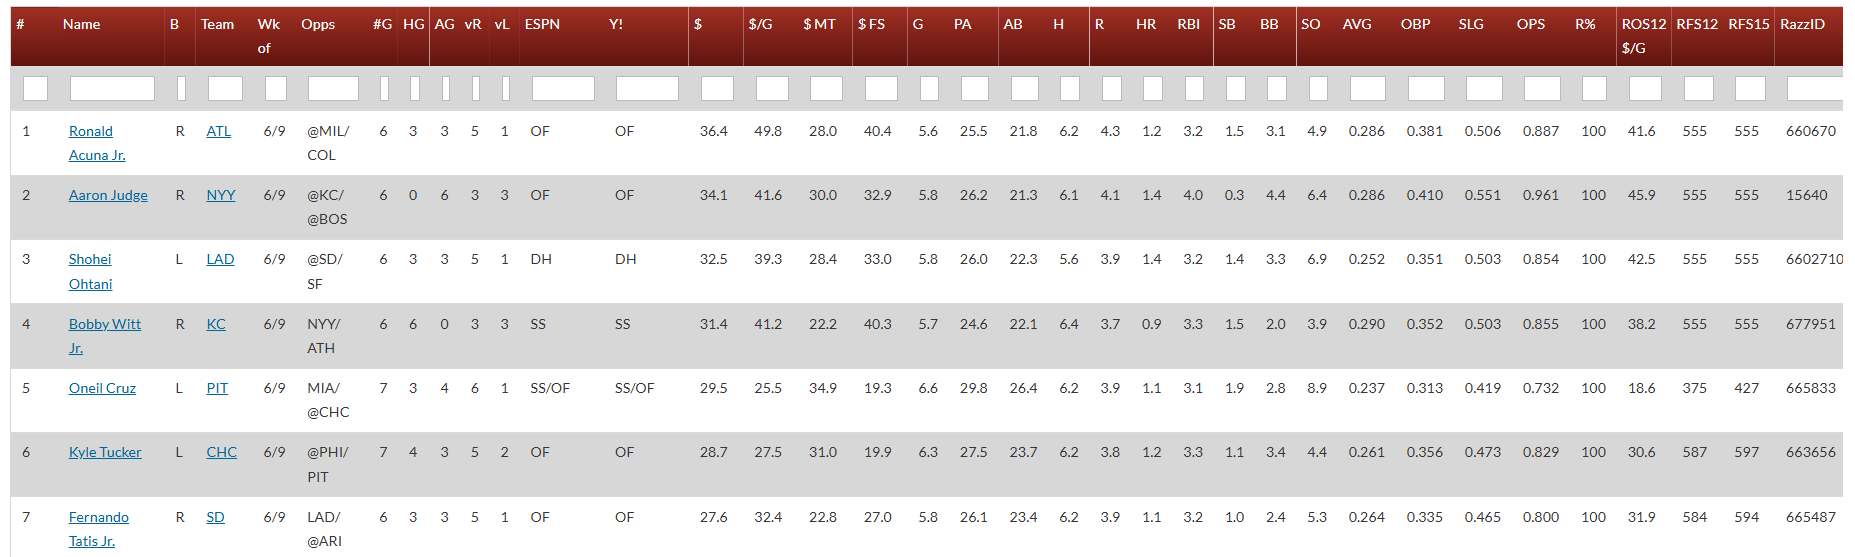
Weekly
Do I need to be good at math to use it?
Nope!
How many games do you project/value?
All MLB games for today + the next 6-9 days. Projections for next week (Mon-Sun) are available beginning on the preceding Friday.
What stats are projected?
The Roto version has Plate Appearances, At Bats, Hits, Runs, HR, RBIs, Stolen Bases, Walks, Strikeouts, AVG, OBP, SLG, OPS. The H2H version removes the ratio stats and adds 1B, 2B, 3B, and HBP. At Bats, Runs, HR, RBI, SB, and AVG Wins are then used to determine the value of each start in 5×5 12-team MLB fantasy baseball auction dollars (AB are used for valuing AVG – a 4 for 6 is more valuable than a 2 for 3).
Why do you rank players based on fantasy baseball auction dollars?
We feel auction dollars work well because they can be directly compared to pre-season $ values (for 12-team ESPN leagues) and our in-season and rest-of-season player raters.
We use a fantasy point formula for the Points version.
What does $ represent in the Roto version of the Hittertron?
12-team mixed league fantasy baseball auction dollars. A $1 player is a ‘replacement’ player – i.e., someone whose performance should be available on waivers. Note that position eligibility is disregarded except for Catchers who are adjusted up slightly.
The value of $ is that it weighs each of the 5 categories appropriately and makes it easy to rank players in Roto leagues.
What scoring is used in the Points version of the Hittertron?
CBSSports: Total Base +1, Run/RBI +1, BB/HBP +1, SB +2, SO -0.5
ESPN: Total Base +1, Run/RBI +1, BB +1, SB +1, SO -1
Fantrax: Total Base +1, Run/RBI +1, BB/HBP +1, SB +2
Yahoo!: Total Base +2.6, Run/RBI +1.9, BB/HBP +2.6, SB +4.2
What does GT mean?
Game Time. It is set at Eastern Standard Time – e.g., 1 = 1PM EST. Any game times prior to 1PM are made negative (e.g., -12 for noon) for easier sorting.
What does %St mean?
The estimated likelihood that a player will start that day (e.g., 95 = 95% chance).
Players confirmed in today’s lineup are at 100 for today’s projections. Any players not in today’s lineup are removed from today’s projections.
How do I sort by stat?
Click the column name to sort in descending order (most to least). Click a second time to sort in ascending order.
How do I identify hitters available in my league?
The ‘R%’ is based on the percentage of leagues that roster a player in the NFBC 12-Team Online Championship. This is updated on Mondays. Filtering this column to include only hitters owned in less than 80% of leagues (<80) is typically a good way to get rid of owned hitters.
What are the text boxes under the column header for?
These are for filtering reports. Report filters allow you to limit the rows to only those that meet your criteria.
You can filter multiple fields at the same time. Below are some examples:
| Function | Symbol | Example | Explanation |
| ANY MATCH | ‘COL’ in Team field | This would filter the results to only Colorado Rockie hitters. | |
| OR | | | Edwin Encarnacion|Jose Bautistar in ‘Name’ | This would display the stats only for Edwin Encarnacion and Jose Bautista. |
| NOT | ! | !SF in Opponent | This would remove all hitters facing the Giants. |
| NOR | ! | | !SD|SF in ‘Team’ | This would display the stats for all hitters EXCEPT Giants and Padres. |
| GREATER THAN | > | >10 in $U | This would only display rows for hitters whose projected $ is greater than 10. |
| LESS THAN | < | <10 in $U | This would only display rows for hitters whose projected $ is less than 10. |
| GREATER THAN OR EQUAL TO | >= | >=10 in $U | This would only display rows for hitters whose projected $ is greater than or equal to 10. |
| LESS THAN OR EQUAL TO | <= | <=10 in $U | This would only display rows for hitters whose projected $ is less than or equal to 10. |
What is a good $ value for streaming a hitter?
This value will vary greatly based on the amount of players in your league’s waiver wire (driven by # of teams + bench sizes), how active your leaguemates are on the waiver wire, the MLB schedule, and the quality of the probable pitchers.
The easy answer is just to maximize your roster’s projected $ as much as you can. If your bench bat is a $1 player and there’s a $10 player on waivers, pick them up.
How do you estimate playing time both for single games and for future games/next week?
There are several factors taken into consideration including: 1) The player’s role with the team (starter, platoon, utility, etc.), 2) Recent playing time, 3) Opposing pitcher (e.g., A right-handed non-catcher will have a much higher projected %St against LHP than RHP), and 4) Player’s roster status (if on IL or in minor leagues, not projected).
For single day $ values, the St% plays NO impact on the $ value. His value is binary – either he starts and is projected at that full $ value or he is sitting and worthless. There is no point to discounting the $ value based on playing time (note: for leagues where you must pick up a player the night before, you typically would not bet on any hitter <75%).
This is not the case with weekly leagues where there are multiple playing time outcomes (e.g., play 7 games, play 5 games, etc.). To ensure that likelihood to start is accounted for, weekly projected stats are the sum of each day’s stats multiplied by the St%. For example, let’s say a hitter is projected to steal 0.4 bases each game for the next 7 days. That would sum up to 2.8 (7*0.4) in the weekly projections IF he was a 100% lock to start each game. If that projection is 50%, the projected SB would fall to 1.4 (7*0.4*0.5).
How do you factor in batting order?
Obviously if the game is today and the lineup is posted, we use that lineup. In general, a player loses about 0.11 PA per spot in the lineup – e.g., a leadoff hitter will have 0.11 more PA than the 2nd place hitter b/c there’s roughly an 11% chance they make the last out. Players who are more frequently swapped out (pinch-ran, pinch-hit, pinch-field) may see PA penalties.
For games where the lineup is not posted, each player receives a composite lineup spot based on recent games where the SP pitches from the same side as that game’s SP. A composite would mean that if a hitter hit 1st 50% of the time and 9th 50% of the time, their projected PAs would be the same as someone hitting 5th.
All hitters on a teams receive a PA adjustment that accounts for: 1) the team’s projected OBP based on the matchups with the opposing SP + RPs + park factors and 2) home/road (home teams may not hit in 9th inning).
Each batting event (e.g., double) has an average R/RBI likelihood. This factor is increased/decreased based on their spot in the batting order – e.g., a hitter projected at 50% 1st, 50% 9th is going to receive the average of those two lineup spot’s R/RBI factors per event.
How do you project these stats?
The projections start with Steamer Rest of Season projections that are updated daily. This is used for setting each player’s park-neutral baseline for HR/PA, BABIP, 1B/2B/3B rates, BB-rate, K-rate, HBP-rate and SB-rate based on how the hitter perform against the average lefty or righty (depending on the probable pitcher).
These stats are then adjusted by Razzball based on several factors including: 1) Quality of opposing pitching (both starter and projected relievers), 2) Park Factors, 3) Weather, and 4) Whether the start is home vs away (hitters perform better at home than road). The primary method for balancing hitter and pitcher is the Odds Ratios devised by Bill James.
These ratios are multiplied into projected PA (explained in the previous question) and each batting event is multiplied by the R/RBI factor (explained in previous question).
How/why do the projections change from when they are first projected (7-10 days before until game time)?
Here are the main factors on why projections should change and their frequency:
- Starting pitcher change – this could happen anywhere from zero times to several times and happen as late as post-lineups if there has been a scratch)
- Projected lineup spot – this can change slightly on a daily basis depending on whether the player started the previous game. generally very minor until lineups post where it could be a major swing if a player vacillates between high value and low value batting order spots
- Weather – this is first accounted for about 3-4 days before the game. while temperature does not change much during that time, wind MPH and direction could
- Projected % Chance of Starting – While this does not affect a daily $ value, it could have a major impact on projected vs actual weekly $ value. The biggest shift here would be if a player is “Out”. If a player’s playing time spikes up/down during the week, the %St projection will also adjust.
- Underlying Change in Player’s Skill Projection – This is very rare but players with very little MLB time would be more affected.
What gameday factors drive hitter $ values the most?
The #1 factor is if there is a game in Colorado. Mediocre hitters become must own hitters in Colorado.
The handedness of the pitcher and hitter play a notable role – LHP starting pitchers lead to both bigger boosts for righty hitters and plummeting $ for lefty hitters. (Vice versa for RHP but to a lesser extent). RH platoon hitters are almost always available on waivers since they get the short end of the playing time stick vs their lefty counterpart.
What does ROS12 $/G mean in the weekly Hittertron?
This stands for Rest of Season 12-team mixed $/Game. The $/Game aims to isolate the quality by estimating a player’s value on a per game basis. This is a more helpful gauge for a hitter’value ON A PER GAME BASIS than ROS $ since it keeps playing time as constant.
The benefit of $/Game is that it provides guidance on a prospect or non-everyday player’s value if they got more of a full-time role.
What does RFS12 and RFS15 mean in the weekly Hittertron?
To help flag the best FAAB candidates, we have added 12-team ROS $/Game and 12 + 15 team Razzball FAAB Score (RFS) that weighs ROS per game value, ROS playing time, and this week’s value on a 0-600 scale roughly tied to 15-team FAAB.
How often are the projections updated?
Today’s projections are updated early in the morning EST and then updated every new batting lineup that is posted.
Future game projections are updated early in the morning EST and then set for several times a day. On Friday-Monday, they are set to update more often AND in a case where a hitter is added/removed from an active MLB roster. These are updated more frequently on weekends to make sure next week projections are as accurate as possible.
In addition Monday-Thursday and Friday-Sunday projections are updated with every new posted lineup on Mondays and Fridays.
How accurate are Hittertron projections?
This is a great question and the most difficult one to answer.
Our goal is to be the most honest, transparent projections on the Internet. Our Ombotsman page has daily correlations for hitter/pitcher stats, roto $ value and DFS points going back to 2014! There is a link on that page that provides instructions on how to read the results on that page.
There is a lot of noise when looking at accuracy at the daily level because there is huge volatility in day-by-day performance. Mike Trout will go 0-for-4 several games throughout the year. A #8 hitter will have a couple games where they get multiple R/RBI. But, over time, it is fair to hypothesize that this volatility averages out and it should be straightforward to demonstrate accuracy.
Below is a distribution that shows the distribution of our projected vs actual hitter roto $ values for the last 30 days. You should generally find an r of over .95 (or r^2 of over .9) when correlating the average projected $ value in each of the 8 ranges (HON_AVG$) against the actual average for those players (ACT_AVG$), the worst outcome (<-$7), and the best outcome ($35+).
| Download Table as CSV | |||
| Note: Filters and sorting in the table below apply to the output | |||
| # | # | $Range | Count | HON_AVG | ACT_AVG | HON_STDDEV | ACT_STDDEV | <-7 | -7-0 | 0-7 | 7-14 | 14-21 | 21-28 | 28-34 | 35+ |
|---|---|---|---|---|---|---|---|---|---|---|---|---|---|---|---|
| 1 | <-$7 | 1901 | -13.4 | -6.0 | 4.9 | 88.1 | 63.1 | 5.4 | 0.2 | 5.3 | 0.3 | 2.1 | 1.7 | 22.0 | |
| 2 | $-7 to $0 | 1646 | -3.5 | 2.3 | 2.0 | 95.5 | 56.4 | 6.4 | 0.3 | 5.0 | 0.4 | 1.9 | 2.6 | 26.9 | |
| 3 | $0 to $7 | 1459 | 3.3 | 7.4 | 2.1 | 102.3 | 52.3 | 5.6 | 0.4 | 6.0 | 1.2 | 2.1 | 1.6 | 30.8 | |
| 4 | $7 to $14 | 1038 | 10.3 | 9.2 | 2.0 | 111.6 | 51.8 | 6.7 | 0.5 | 6.1 | 0.5 | 1.9 | 3.2 | 29.3 | |
| 5 | $14 to $21 | 651 | 17.2 | 11.3 | 2.0 | 108.6 | 51.9 | 5.2 | 0.5 | 4.0 | 0.9 | 1.5 | 3.4 | 32.6 | |
| 6 | $21 to $28 | 378 | 24.1 | 16.6 | 2.0 | 109.8 | 46.3 | 7.9 | 0.0 | 4.0 | 1.9 | 3.4 | 2.9 | 33.6 | |
| 7 | $28 to $35 | 192 | 31.3 | 13.8 | 2.0 | 111.1 | 47.9 | 6.8 | 0.5 | 6.3 | 1.0 | 3.6 | 1.6 | 32.3 | |
| 8 | $35+ | 191 | 43.8 | 26.6 | 8.5 | 121.2 | 40.8 | 5.2 | 0.5 | 3.7 | 1.0 | 2.1 | 6.3 | 40.3 |
The ACT_STDEV_PTS column underscores the crazy volatility found in hitter performances. The standard deviations for each range fall between $90-$130 which means that 68% of the time. A hitter projected at $20 is projected to fall between -$108 and $148. This is illustrated by the distribution showing the percent of time each hitter projection bucket (e.g., $10.5 to $14) fell into each actual $ bucket. As you can see, even the top hitting tier are worth negative value 45+% of the time.
There is nothing a daily projection system can do about this inherent volatility – the best measure of its success is how well it performs against the average. And Hittertron does well in that regard.
How do Hittertron projections compare to other projection sources?
Honestly, hard to say. We do not have access to other subscription services and there aren’t many that do what we do (ESPECIALLY projecting 7-10 days in advance).
We feel really very confident in what we do. Not cocky since it is a humbling endeavor. But confident.
How often do you update/upgrade the methodology behind Hittertron?
We are constantly looking for ways to improve the projections. The extent we update/upgrade the methodology will vary based on 1) our access to additional data sets, 2) free time to research and test any additions/changes and 3) inspiration.
Can I customize the $ values to meet my league settings or category preferences (e.g., I value K’s more than Win percentage because it is more reliable)?
Unfortunately, not on the site. You can download either the roto or points versions though and apply whatever custom values you desire.
Maintained by Rudy Gamble ([email protected])Razzball.com and the Razzball logo units are copyright Razzball LLC.
What is the easiest way to just get a view of your teams hitters if you use Yahoo and can’t upload a csv?
1) Download the Hitter data and use Excel/Google Sheets filters to filter your players
2) Use the Hittertron filters below the column names and enter your players with * before and after some/all their name separated by | – e.g., *Shea L* | *Vinnie P* | *Francisco Lin*