What is DFSBot?
DFSBot helps identify the best hitter and pitcher values – as well as hitter stacks – for DraftKings, FanDuel, Yahoo!, and FantasyDraft. A lineup optimizer powered by Daily Fantasy Cafe is available for DraftKings, FanDuel, and Yahoo MLB.
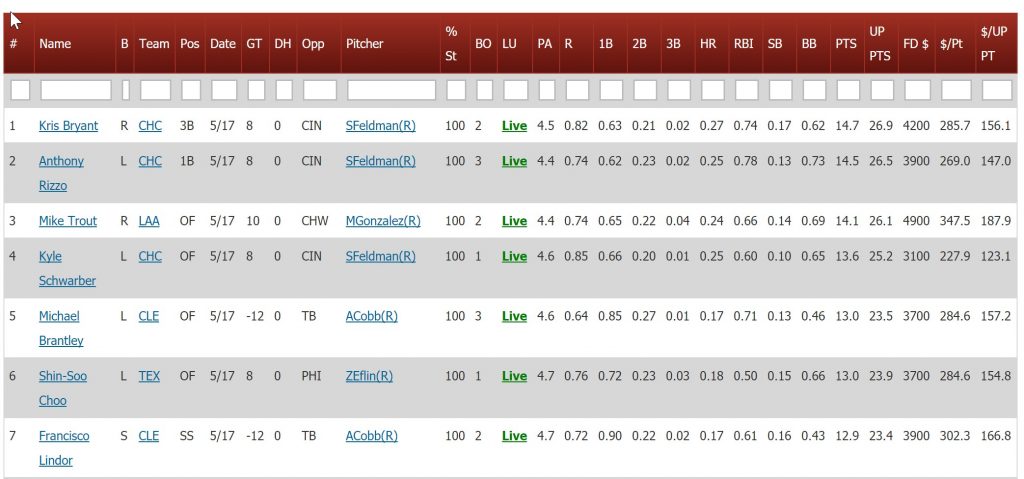
DFSBot – Hitters
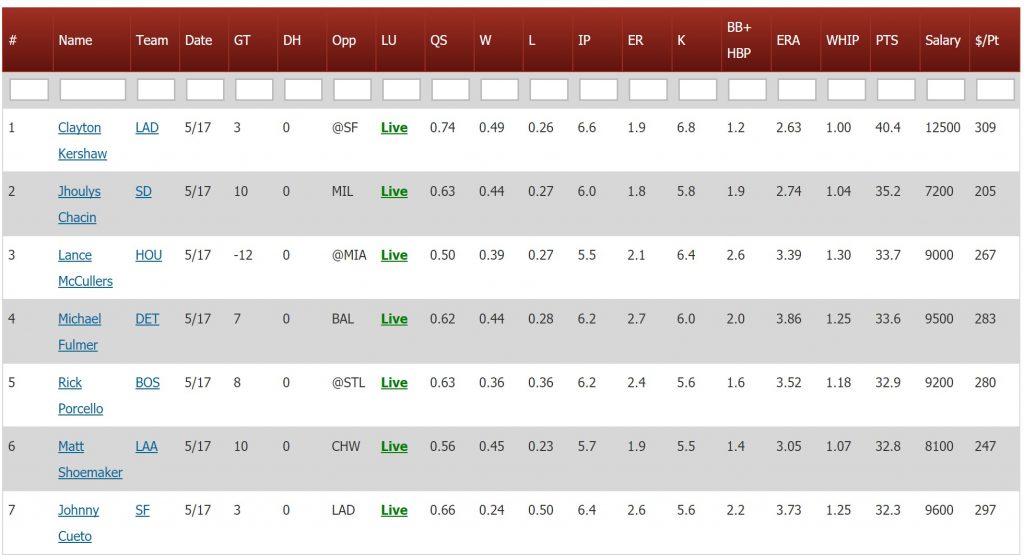
DFSBot – Pitchers
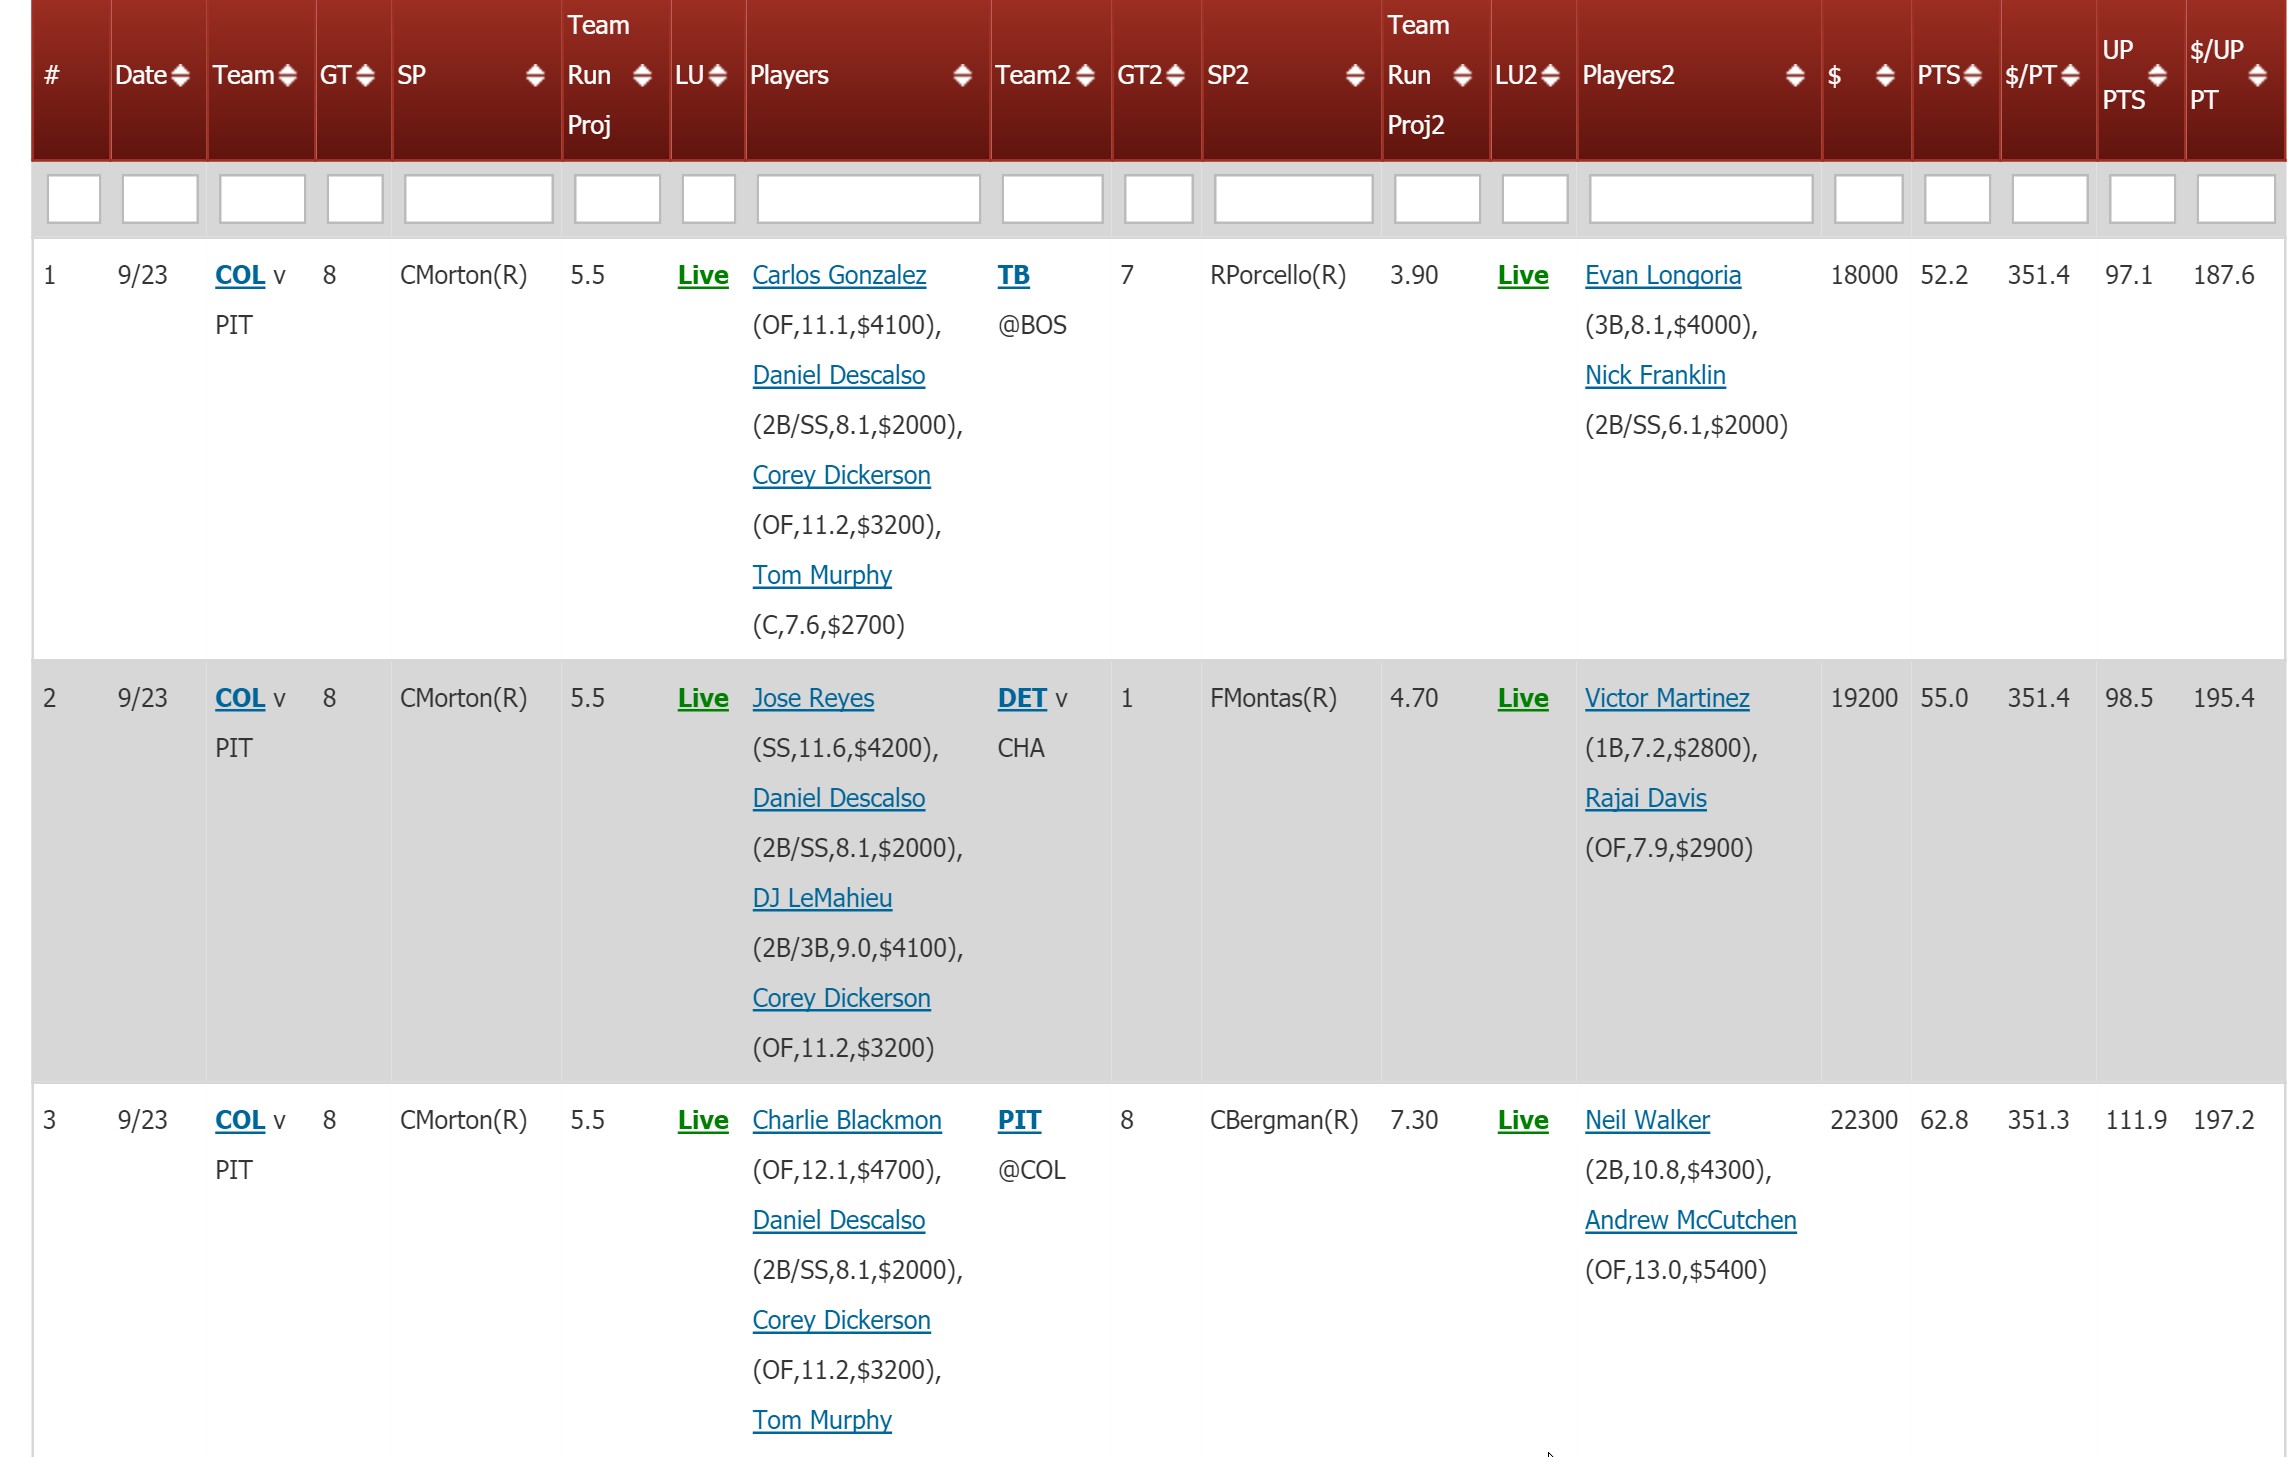
Lineup Stacks (Stackonator)
Lineup Optimizer Tutorial (powered by Daily Fantasy Cafe)
How are Razzball DFS projections different than other DFS projection systems?
1) Quality – The foundation of daily projections are reliable baseline estimates of player skills. Razzball partners with Steamer Projections – one of the most respected projection methodologies – so we have the best available hitter and pitcher ‘split’ data (i.e., how a RHP is projected to do against right-handed hitters and vice versa). We update these projections daily. These hitter/pitcher baseline projections are markedly better than using previous season or in-season split data. Gameday adjustments (e.g., park factors, lineup, weather) are made based on quality sources and rigorous backtesting.
2) Transparency – We display all the underlying projected stats (on DFSBot with expanded stats in Streamonator and Hittertron). Our Rest of Season projections as well as projected hitter split data (vs LHP/RHP) are available on all our player pages. We test our DFS Point projections – as well as various underlying stats like HRs, K’s, etc. – on a daily basis and publish it on our Ombotsman page.
3) Our Love of Roto – If you play DFS and Season-Long Roto, your Razzball DFS Premium subscription also buys you access to our daily and weekly hitter/SP projections. If you are DFS-only, you still benefit from our passion because we dig into things that DFS-only sites will not like how to project starting time for games without posted lineups.
What DFS services are in DFSBot & the MLB Lineup Optimizer?
DraftKings, FanDuel, Yahoo, and FantasyDraft are available in the DFSBot projections and the Stackontaor. DraftKings, FanDuel, and Yahoo are available in the Optimizer.
What do the columns stand for?
Here are the columns that are not self-explanatory:
| Column Name | Explanation |
| B | Bats – R=Right, L=Left, S=Switch |
| Pos | All the positions one is eligible for in that specific DFS service |
| GT | Game Time. It is set at Eastern Standard Time – e.g., 1 = 1PM EST. |
| DH | DoubleHeader. Set to 0 if no Double Header. 1 if Game 1. 2 if Game 2. |
| %St | Estimated chance of a hitter being in the starting lineup. This is determined using last 30 game data and takes platoons into account. Players not on the active roster or DL are removed altogether. If the starting lineup has been posted, this will change to 100 (no hitter is projected greater than 95%). |
| BO | Batting Order. Blank if lineups are not in. Lists batting order when lineups are in. |
| LU | Lineup. Links to the lineup if posted. Otherwise, links to last 7 days worth of lineups. |
| PTS | Projected points based on the average (50th) percentile outcome. |
| $/Pt | The DFS Salary divided by projected points. The lower this number, the better the value. |
| Up Pts | This is a hitter’s ‘upside’ points. It is a projection of their 86th percentile outcome (i.e., one standard deviation). In the Optimizer, the standard points are noted as ‘Cash’ and the ‘Upside’ points are listed as GPP. |
| $/Up Pt | The DFS Salary divided by one’s Upside Points. The lower the number, the better the value. |
How should I use DFSBot?
We defer to DFS players when it comes to specific strategy but here are our tips for general strategy:
Guaranteed Price Pool (GPP) – This format pays out handsomely to a small percentage of teams. The douchy phrase ‘Go big or go home’ does apply here. You want to invest a good chunk of your DFS Salary on ‘upside’ players – the types that IF they have a big day, they are worth a lot of points. This rewards power as well as lineup position (for R/RBI). To find high ‘upside’ players, sort the $/Up Pt column in ascending order. If you are using the Daily Fantasy Cafe lineup optimizer, you will want to use either the ‘GPP’ projection or the 67% GPP (which is (2*GPP Projection + Cash projection)/3).
In addition, winning GPP lineups often ‘stack’ 1-2 MLB lineups since there is a greater chance that one offense blows up and scores 10 runs and, thus, a greater chance that multiple players in your lineup will approach/beat their ‘upside’ projection. The Stackonator lets you review 1,000 different lineup stacks in various combinations such as ‘4 bats on a team’, ‘4 bats on one team, 3 bats on another team’, etc.
50/50 and contests with distributed payouts – This format caters to ‘value’ plays. The $/Pt column (sorted in ascending order) is your best bet for value plays. If you are using the Daily Fantasy Cafe MLB lineup optimizer, leave it on the ‘Cash’ projection default or perhaps to 33% GPP.
We HIGHLY recommend using the Daily Fantasy Cafe lineup optimizer for DraftKing, FanDuel, and Yahoo! which includes Razzball projections (for subscribers). I have optimized lineups via Excel’s ‘Solver’ feature and Daily Fantasy Cafe crushes it both in the number of unique lineups and projected points.
What are upside points?
A hitter’s ‘Upside Points’ represent a near ‘best case’ game for them. In stat terms, it is their 86th percentile outcome whereas the average is 50th percentile outcome. In stattier terms, it is one standard deviation from their average point projection.
A hitter’s upside points is somewhat correlated to a hitter’s average points (e.g., Mike Trout excellent in both, Nick Ahmed awful in both) but there is a greater impact for power hitters as total bases (and particularly HRs) drives DFS point totals. I’ve done analysis on two year’s worth of hitter data to identify how much to weight a player’s power when determining their upside points.
Since there is a high degree of proportionality between a hitter’s average and upside points, the impact on optimized DFS lineups will be mild but will favor 2nd-tier, all-or-nothing slugger types over leadoff hitters.
For pitchers, my analysis bore out that there are no stats/skills that drive a pitcher’s point variance. The calculation for a pitcher’s upside points is simply adding a constant point total and then a percentage of their average point total. So a high-K/high ERA/low IP pitcher worth 15 average points will have the same upside total as a medium K/medium ERA/high IP pitcher worth 15 points.
Given that this calculation does not change the pitcher rankings, there are no ‘Upside’ pitcher projections and there is no distinction between ‘Cash’ and ‘GPP’ projections in the Lineup Optimizer.
When do DFSBot projections go live?
Today’s projections typically go up around 1AM EST and then are updated throughout the day up to 10PM EST to incorporate posted lineups.
The underlying projections – without weather and posted lineup adjustments – are available as early as a week in advance by using Streamonator or Hittertron.
Do your projections reflect actual lineups?
Yes. We update several times a day to reflect posted lineups. Actual lineups lead to the best projections for hitter stats (more accurate Plate Appearances, some shifts in R/RBI) and SP stats.
But we have invested a lot of time to ensure that projections sans posted lineups (either in the morning or for west coast games) are as accurate as possible. We have found our projected PA/AB projections pre-lineups are only a couple correlation points worse than based on actual lineups. The only major differences are players moving from the bottom to the top of the lineup and vice versa.
How do I sort by stat?
Click the column name to sort in descending order (most to least). Click a second time to sort in ascending order.
What are the text boxes under the column header for?
These are for filtering reports. Report filters allow you to limit the rows to only those that meet your criteria.
You can filter multiple fields at the same time. Below are some examples:
| Function | Symbol | Example | Explanation |
| ANY MATCH | ‘NY’ in Opponent field | This would filter the results to only pitchers facing the New York Yankees (NYA) and New York Mets (NYN) | |
| OR | | | David Price|Justin Verlander in ‘Name’ | This would display the stats only for David Priceand Justin Verlander. |
| NOT | ! | !at in Opponent | This would remove all away starts (an away game for Atlanta written as ‘at ATL’) |
| NOR | ! | | !David Price|Justin Verlander in ‘Name’ | This would display the stats for all pitchers EXCEPT David Price and Justin Verlander |
| GREATER THAN | > | >4000 in $ | This would only display rows for pitchers whose projected $ is greater than 10. |
| LESS THAN | < | <4000 in $ | This would only display rows for pitchers whose projected $ is less than 10. |
| GREATER THAN OR EQUAL TO | >= | >=10 in $ | This would only display rows for pitchers whose projected $ is greater than or equal to 10. |
| LESS THAN OR EQUAL TO | <= | <=10 in $ | This would only display rows for pitchers whose projected $ is less than or equal to 10. |
How do you project hitter stats?
The projections start with Steamer Rest of Season projections that are updated daily. This is used for setting each player’s park-neutral baseline for HR/PA, BABIP, 1B/2B/3B rates, BB-rate, K-rate, HBP-rate and SB-rate based on how the hitter perform against the average lefty or righty (depending on the probable pitcher).
These stats are then adjusted by Razzball based on the following factors: 1) Quality of opposing pitching (both starter and projected relievers), 2) Park Factors, and 3) Whether the start is home vs away (hitters perform better at home than road). In addition, some of today’s stats are adjusted based on weather conditions. The primary method for balancing hitter and pitcher is the Odds Ratios devised by Bill James.
These ratios are multiplied into projected PA. These are based on last 15-30 days and adjust based on handedness of starting pitcher (e.g., Rajai Davis might hit higher in lineup vs LHP than RHP) as well as the quality of the pitchers and lineup (e.g., the worse the pitcher, more projected PAs for the team).
Runs and RBI projections factor projected lineup position, lineup strength, and opposing pitcher strength.
How do you project starting pitcher stats?
The projections start with Steamer Rest of Season projections that are updated daily. This is used for setting each player’s park-neutral baseline for ERA, K-rate, BB-rate, HR-rate, HBP-rate, and BABIP. These stats are then adjusted by Razzball based on the following factors: 1) Projected opposing team lineup’s ability vs the pitcher’s handedness (i.e., RHP vs LHP), 2) Park factors, and 3) Whether the start is home vs away (pitcher’s perform better at home than road).
For today’s projection, the results are updated several times a day to take advantage of posted lineups. Weather conditions are also incorporated into today’s projections.
The ratios are multiplied into projected IP based on a pitcher’s recent starts with adjustments made based on projected baserunners (e.g., the better the WHIP, the more IP).
Win, Loss, and Quality Start percentages are based on formulas leveraging the ERA projections (including the opposing pitcher’s ERA for Wins/Losses).
How do you project relief pitcher stats?
Bullpen projections are driven based on last 30 day team usage as well as the projected starter IP. Injured and demoted pitchers are not included. For today’s projections, relievers are removed if they pitched 2 days in a row or pitched past a certain threshold of batters the prior day.
This data is currently used for the ‘opponent pitcher strength’ calculations for hitters.
How accurate are the projections?
This is a great question and the most difficult one to answer.
Our goal is to provide the most honest, transparent projections on the Internet. We appointed a dedicated robot (the Ombotsman) to provide daily updates on our accuracy. Here are the results for every day of 2015 and every day from May to September 2014. In-season results are added on a daily basis. There is a link on that page that provides instructions on how to read the results on that page.
There is a lot of noise when looking at accuracy at the daily level because there is huge volatility in day-by-day performance. Some days, great hitters and aces dominate while weak bats and meatball flingers get crushed. Other days, the opposite happens. But, over time, it is fair to hypothesize that this volatility averages out and it should be straightforward to demonstrate accuracy.
Here is the easiest way we have figured out how to demonstrate our accuracy. This is using roto $ (from our Streamonator) vs DFS points but these stats correlate highly.
As you will see below, there is a lot of volatility in daily hitter/pitcher performance. There is not much a daily projection system can do about this inherent volatility so the best measure of its success is how well it performs against the average. And we do very well in that regard.
Hitting
Below is a distribution that includes every projected hitter start from July through September of 2015. The average projected $ value in Hittertron (HON_AVG$) projected for each bucket correlates nearly perfectly (0.953) with the $ average in each bucket.
| Download Table as CSV | |||
| Note: Filters and sorting in the table below apply to the output | |||
| # | $Range | Count | HON_AVG$ | ACT_AVG$ | HON_STDDEV$ | ACT_STDDEV$ | <-7 | -7-0 | 0-7 | 7-14 | 14-21 | 21-28 | 28-34 | 35+ |
|---|---|---|---|---|---|---|---|---|---|---|---|---|---|---|
| $-7 to $0 | 924 | -3.3 | -3.48 | 2.03 | 93.28 | 57.8 | 6.9 | 3.1 | 1.2 | 1.2 | 1.7 | 2.6 | 25.4 | |
| $0 to $3.5 | 531 | 1.7 | -1.02 | 1.02 | 98.01 | 57.6 | 7.2 | 4.3 | 1.1 | 0.9 | 2.4 | 2.1 | 24.3 | |
| $10.5 to $14 | 389 | 12.2 | 4.77 | 1.01 | 97.32 | 54.5 | 7.2 | 2.3 | 1.3 | 0.8 | 1.5 | 2.1 | 30.3 | |
| $14 to $17.5 | 350 | 15.7 | 17.40 | 1.02 | 107.16 | 50.9 | 8.9 | 2.9 | 0.6 | 0.3 | 1.4 | 1.1 | 34.0 | |
| $17.5 to $21 | 317 | 19.2 | 29.29 | 1.05 | 128.12 | 48.9 | 5.7 | 2.5 | 0.6 | 0.6 | 2.2 | 1.3 | 38.2 | |
| $21 to $28 | 503 | 24.3 | 25.87 | 2.01 | 121.62 | 49.3 | 6.6 | 2.8 | 0.6 | 1.2 | 2.6 | 2.4 | 34.6 | |
| $28 to $35 | 331 | 31.1 | 24.42 | 1.99 | 122.58 | 53.5 | 5.1 | 3.0 | 0.3 | 0.6 | 2.1 | 0.6 | 34.7 | |
| $3.5 to $7 | 487 | 5.2 | 8.14 | 0.98 | 102.06 | 55.4 | 4.9 | 3.3 | 0.6 | 0.4 | 0.8 | 3.1 | 31.4 | |
| $35+ | 459 | 47.2 | 40.29 | 12.03 | 133.29 | 45.8 | 6.8 | 2.4 | 1.3 | 0.7 | 3.1 | 1.3 | 38.8 | |
| $7 to $10.5 | 451 | 8.7 | 8.07 | 0.98 | 107.94 | 55.7 | 5.5 | 4.9 | 0.7 | 0.4 | 0.7 | 2.4 | 29.7 | |
| <-$7 | 1265 | -14.8 | -14.22 | 6.01 | 91.06 | 64.3 | 6.0 | 5.1 | 1.4 | 0.9 | 1.5 | 0.8 | 20.1 |
The ACT_STDEV_PTS column underscores the crazy volatility found in hitter performances. The standard deviations for each range fall between $90-$130 which means that 68% of the time. A hitter projected at $20 is projected to fall between -$108 and $148. This is illustrated by the distribution showing the percent of time each hitter projection bucket (e.g., $10.5 to $14) fell into each actual $ bucket. As you can see, even the top hitting tier are worth negative value 45+% of the time.
Pitching
Below is a distribution that includes every projected start from 2015. The average projected $ value (Stream-o-Nator AVG$) projected for each bucket matches nearly perfectly with the actual average (Actual AVG$).
| Download Table as CSV | |||
| Note: Filters and sorting in the table below apply to the output | |||
| # | $Range | Count | Stream-o-Nator AVG$ | Actual AVG$ | Stream-o-nator STDDEV$ | Actual STDDEV$ | Below -$7 | -$7- $0 | $0- $7 | $7- $14 | $14- $21 | $21- $28 | $28+ |
|---|---|---|---|---|---|---|---|---|---|---|---|---|---|
| $-7 to $0 | 761 | -3.6 | -12.0 | 1.98 | 81.64 | 53.4 | 3.5 | 2.9 | 2.0 | 3.3 | 2.4 | 32.6 | |
| $0 to $3.5 | 402 | 1.7 | -4.7 | 1.05 | 84.11 | 49.8 | 2.0 | 3.0 | 4.0 | 3.2 | 2.0 | 36.1 | |
| $10.5 to $14 | 269 | 12.1 | 21.5 | 1.00 | 79.79 | 35.3 | 3.3 | 3.3 | 3.0 | 4.8 | 1.5 | 48.7 | |
| $14 to $17.5 | 196 | 15.7 | 11.5 | 1.06 | 75.21 | 41.3 | 2.6 | 5.1 | 5.1 | 1.0 | 2.6 | 42.3 | |
| $17.5 to $21 | 174 | 19.2 | 19.1 | 1.07 | 82.22 | 40.2 | 2.3 | 1.7 | 0.6 | 1.7 | 1.7 | 51.7 | |
| $21 to $28 | 229 | 24.5 | 32.3 | 1.98 | 76.02 | 34.1 | 2.6 | 1.7 | 3.9 | 4.4 | 4.8 | 48.5 | |
| $28+ | 334 | 39.1 | 41.0 | 10.30 | 87.62 | 27.2 | 3.3 | 3.0 | 3.6 | 1.8 | 3.6 | 57.5 | |
| $3.5 to $7 | 366 | 5.2 | 0.7 | 1.04 | 75.06 | 47.8 | 4.1 | 2.2 | 3.0 | 3.8 | 4.6 | 34.4 | |
| $7 to $10.5 | 317 | 8.7 | 8.4 | 1.03 | 80.10 | 41.0 | 3.8 | 3.5 | 2.8 | 3.5 | 4.1 | 41.3 | |
| <-$7 | 1769 | -18.6 | -26.1 | 8.99 | 81.13 | 60.6 | 2.6 | 3.0 | 2.3 | 1.8 | 1.2 | 28.4 |
The Actual STDDEV$ column underscores the crazy volatility found in starting pitching performances. The standard deviations for each range are between $69-$87 which means that 68% of the time, a pitcher’s start value will be about +/- $75 from the projection.
How do your projections compare to other projection sources?
Um, great! Stupendous!
Honestly, hard to say. We do not have access to other subscription services. Googling uncovers the occasional study that seems pretty favorable. Here is one we did against NumberFire in 2015.
We do a LOT of testing against any sources we can get our hands on as it helps us uncover stats where we can improve.
The learnings from all that testing has given us enough confidence that we put out an accuracy challenge to anyone who does Daily Fantasy Sports projections in mid-July 2015 (no takers to date).
How does your projection methodology compare to other sources?
There are SO many choices and variables that go into each part of a projection methodology so even two seemingly identical methodologies can produce contradictory results. I think the most critical aspects are the quality of: 1) the data inputs (such as baseline projections), 2) the methodological assumptions/research, and 3) the execution (so easy to f*** up code/calculations).
It is relatively easy to make a decent projection system that performs a little bit better than a DFS site’s salary algorithms. It is significantly harder (and time-consuming) to nudge the accuracy from that point.
I have found it to be a constant learning process filled with demotivating dead ends, Hanna Barberian running in place, and the occasional exhilirating ‘eureka’ moment. But the results of this process is, I think/hope, uncovering small edges in accuracy that improve the winning chances of our customers.
Some general comments on broader methodology differences:
- Simulators vs. Projecting Based on Average Likelihood (my methodology) – If done well, the differences between these two should be virtually nil. At the end of the day, it comes down to projecting each pitcher/hitter confrontation as well as possible. Simulation, in concept, should have a slim advantage in projecting R/RBI given it accounts for the interdependencies between lineup spots but extensive research has shown that lineup construction has a very minor impact on a team’s total runs scored. I believe my model – which adjusts the R/RBI impact of hitter events per lineup slot – performs as well as a well-done simulation while providing additional benefits (e.g., we can project for every active hitter on a team instead of a projected lineup, we project out 7-10 days in advance)
- Projecting DFS Points Based on Underlying Components Vs a Model That Projects Just Points – While sabermetric and roto-lovers would base their projections on actual baseball events, I suspect several DFS projectors focus their research on DFS points and then adjust a player’s baseline PTS based on various factors like opposing pitcher, park, weather, etc. I imagine this is the methodology behind most of the DFS Salaries. While it is not completely inconceivable for this methodology to approximate the accuracy of ‘bottom-up’ projections, my initial assumption would be that these are hack, lower quality projections.
Can I customize the values based on how I weight each category (e.g., I value K’s more than Wins because it is more reliable)?
We are looking into this. In the interim, we provide the projections so you can cut/paste and re-weight to your heart’s delight.
Razzball.com and the Razzball logo units are copyright Razzball LLC.