
I wrote a detailed post last year on position adjustments where I looked at the subject from a few different angles. While I still have the same position that the concept of ‘position scarcity’ (aka boosting up the values of certain positions like C/2B/SS) in mixed leagues is false but largely benign, the illogicality and non-stop reference to it in posts/podcasts is driving me a little nuttier this year. Hence, another post.
I will be focusing on standard mixed league formats. AL/NL-only is a different beast where ‘scarcity’ could occur at any position given the percentage of major league starting players who are drafted.
To start, here is a hypothetical question. Let’s say a player is projected at 80/20/80/5/.280. Should he more expensive in a draft as a 2B or a 3B? Catcher or SS? 1B or OF?
I believe that his value does not change (except a bit with a catcher in 2 catcher leagues). Perhaps add a dollar if he has useful multi-position eligibility and remove a dollar or two for a DH. But the difference most people think exists is largely a false perception like how one might feel a ton of feathers would be lighter than a ton of lead.
While it’s nitpicky, I dislike the term ‘scarcity’ in mixed league fantasy baseball as the word implies there is not enough to go around and someone is getting nothing. Musical chairs is a game of scarcity. Finding a woman in polygamist societies is a game of scarcity. You can wait until the absolute last round and still find a player at every position. Inequality is a more fitting word. Anyone who thinks those are synonyms should make themselves inequal. But for easier comprehension and SEO purposes, I’ll call it position scarcity throughout the post.
I think the belief in ‘position scarcity’ is rooted in thinking one or both of the following is true:
- Certain positions have lower floors/replacement values than others (e.g., the last drafted OF is greater than the last drafted SS) thus a player from a position with lower replacement value has more marginal value.
- Certain positions have fewer ‘stars’ and thus one gains a relative advantage vs competitors by having a rare positional star (e.g. Posey as your catcher)
Do certain positions have lower floors/replacement values than others and, if so, how should we handle it?
Below is a dollar value distribution by position that I took from my ESPN 12 team mixed projections (C/1B/2B/SS/3B/5 OF/CI/MI/UTIL). I broke up OF into OF1 through OF5 to fit the grid on the page.
Positions for multi-position eligible hitters are assigned in the following order of most to least valuable: C/SS/2B/3B/OF/1B/DH. The only position adjustment made was an approximate $1.60 boost to all catchers so that the last catcher is worth $1. I will revisit that decision at the end of this section. The dollars are calculated by my own methodology that’s a variant of Standings Gain Points (SGP) where I focus on a player’s contributions versus the average rostered hitter vs a ‘replacement’ hitter. (I’m overdue to update my FAQs on this after some notable changes last year.)
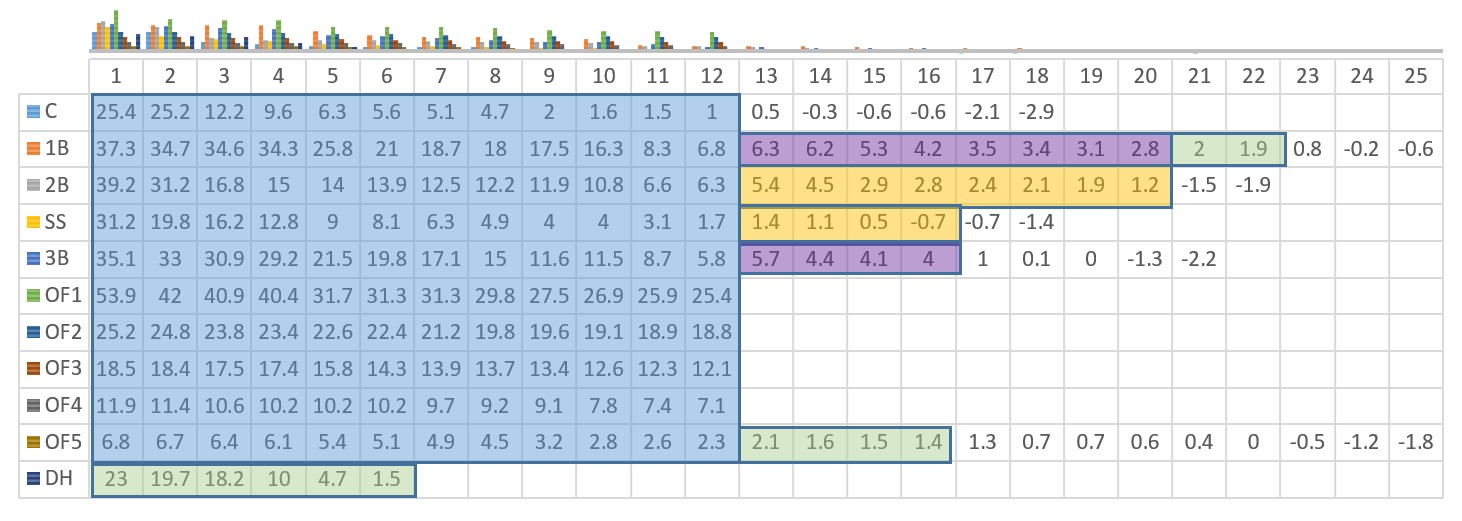
If we focus on the blue highlighted boxes, it is clear that if each of the 12 teams only picked one player per position (not including DH), the floor for C and SS are lower than the other positions (with OF being next). But once we take out 12 1B/3B (purple), 12 2B/SS (orange), and 12 UTIL (green), the ‘floor’ of each position resides somewhere between $-0.7 and $1.9 (aside from a fluky 3B result) and the replacement values range from -1.5 to 1.3. Note that if I remove the +1.6 I added to all catchers that the floor and replacement value would fall within these ranges (floor of -$0.6, replacement of -$1.1)
I do not consider the differences in floor/replacement values to have any real statistical significance. The CI/MI/UTIL roster slots seem to effectively level any surplus/advantage from any position. Below are the stats for all the hitters valued between $0.5 and $1.5 to give a flavor to how homogenous the statistics are for this player pool.
| Name | MVPos | PA | R | HR | RBI | SB | AVG | $ |
| Alex Rodriguez | DH | 560 | 65 | 20 | 68 | 3 | .239 | 1.5 |
| Jayson Werth | OF | 538 | 61 | 15 | 61 | 4 | .265 | 1.5 |
| Devin Mesoraco | C | 436 | 47 | 17 | 54 | 3 | .242 | 1.5 |
| Domingo Santana | OF | 519 | 56 | 19 | 63 | 6 | .249 | 1.4 |
| Marcus Semien | SS | 538 | 62 | 15 | 59 | 10 | .250 | 1.4 |
| Nori Aoki | OF | 577 | 65 | 6 | 45 | 16 | .269 | 1.3 |
| Scooter Gennett | 2B | 584 | 59 | 11 | 56 | 7 | .275 | 1.2 |
| Jhonny Peralta | SS | 578 | 60 | 15 | 66 | 3 | .262 | 1.1 |
| Yasmani Grandal | C | 458 | 50 | 16 | 54 | 2 | .241 | 1.0 |
| David Wright | 3B | 543 | 62 | 13 | 56 | 7 | .265 | 1.0 |
| Chris Carter | 1B | 492 | 58 | 27 | 68 | 3 | .223 | 0.8 |
| Corey Dickerson | OF | 476 | 55 | 17 | 61 | 5 | .262 | 0.7 |
| Michael Conforto | OF | 546 | 58 | 18 | 66 | 3 | .255 | 0.7 |
| Addison Russell | SS | 565 | 60 | 15 | 63 | 9 | .247 | 0.5 |
| Stephen Vogt | C | 443 | 48 | 12 | 52 | 2 | .259 | 0.5 |
Here is the same distribution for the standard NFBC roster format (15 teams, C/C/1B/2B/SS/3B/5 OF/CI/MI/UTIL). The boost to catchers to ensure the 15th catcher is at $1 is only $0.70.
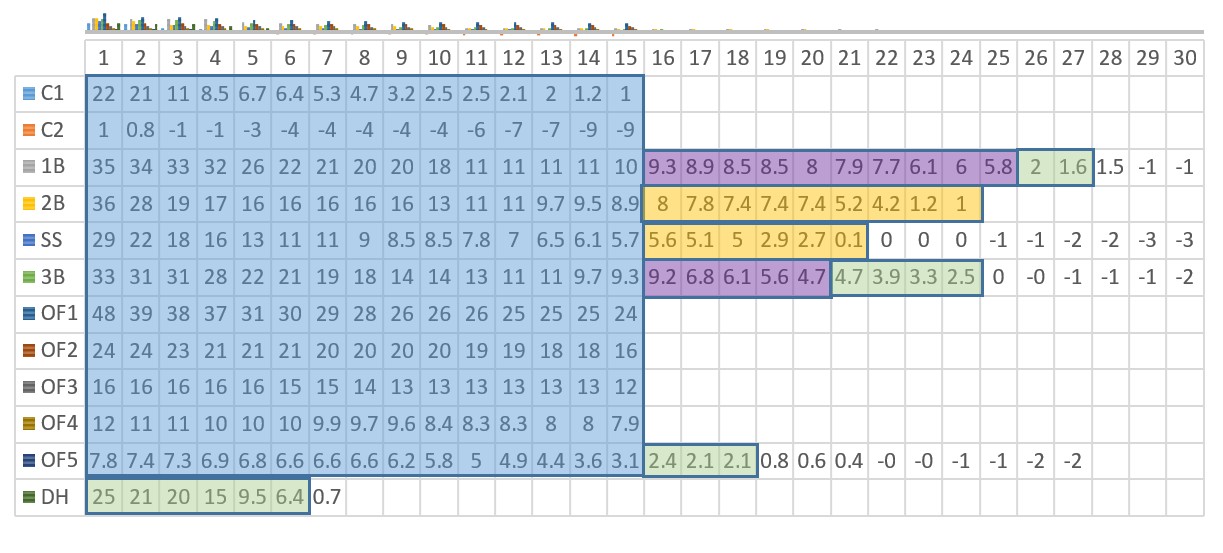
Again, the leveling function of the CI/MI/UTIL has brought the ‘floor’ value range for all rostered positions (except 2nd catcher) to between 0.1 and 2.5 and replacement value range between 0 and 1.5. These are narrow ranges where the differences appear to be noise vs something statistically significant. The fact that there are less shortstops greater than $1 than other positions does not matter because there are enough to fill out the SS spot and contribute for MI.
So if you do not consider Corey Seager to be a top 50 player as an OF in mixed-league drafts, there is no basis for considering him a top 50 player as a SS.
Now 2nd catcher, that gets ugly. The last catcher is at negative $9 (and that’s with a 70 cent boost!). This is not surprising when you consider that: 1) You are drafting a catcher per MLB team whereas other positions are only drafting about 0.75 per team, 2) catchers average less playing time than position players, 2) catchers are typically defense-first players, and 4) catchers are more likely to do a 50/50 share (vs standard righty/lefty platoon). So how should we handle it?
The traditional approach would be to add $10 to all catchers so the last catcher is worth $1 (-9+10). This would mean that drafters would divert $300 of its pre-draft hitter dollars across the 30 catchers. To give some perspective, if we assign 67% of $260 for hitter dollars and then multiply by 15 teams, it equals about $2600. So this redistribution represents over 10% of all hitter dollars. (For snake drafters, this is the equivalent of moving all but the very top catchers up several rounds).
I can think of two instances where one could justify adding a premium to a good’s true worth (where there is no true scarcity in supply, time, etc.):
- Insurance – You reduce the risk/exposure of a worst case outcome (car crash, home damage, death, etc.) with insurance. You are paying more than it’s true value since there has to be something in it for the insurance company to offer the downside protection.
- Inflation – The market inflates the price of a required good so you have no choice to pay the premium – e.g., concessions at a movie theater.
The $10 premium on all catchers does not make sense from an Insurance point of view because the WORST CASE scenario is you are paying a $10 premium per catcher by getting the two worst catchers for $1 leading to a net loss of $20. With that floor in place, you should look to buy catchers for less than a $10 premium.
So what would a more realistic ‘insurance’ premium be? Well, the first 16 catchers in the above example are priced at $1 or more. Since they are all greater than or equal to the minimum bid (or pick value in a snake draft), they at least have the potential to be bought at face value. The premium one puts on these 16 catchers is largely insurance – saving you from drafting one of the below minimum bid players. The threat of being stuck with a below min bid catcher increases the more catchers taken – e.g., when you take Buster Posey as the first catcher, there is only a 14/29th chance that you were going to get a below average pick. But that last $1 catcher is your final chance to potentially buy at ‘face value’ so the odds are now 100%.
The formula I used for the ‘Rudy’s Premium’ column for $1+ players is:
(ABS(AVERAGE(Negative Val Catchers)+Min Bid)*COUNT(Negative Val Catchers)/29
So the premium for Buster Posey (the $22.3 catcher) is calculated as (4.4+1) * 14/29 = 2.60 with the average of the under $1 catchers equaling -4.4 (converted to absolute value of 4.4) and adding in an extra $1 for min bid to reflect that the average premium you are paying for that whole group is $5.4.
This premium increases steadily up to the 16th catcher where one could warrant the full $5.40 premium. For the below $1 players, the formula changes to:
(ABS(AVERAGE(Remaining Negative Val Catchers))+Catcher Value)
So the premium on the 29th catcher is worth (8.85)+-8.6=$0.25 with 8.85 being the absolute average of -8.6 and -9.1. In essence, your premium in this case is half the difference of the two.
Here is a grid with these calculated premiums alongside the old school method:
| Rank | Value | Rudy’s Premium | Adjusted Value | Old-School Premium | Adjusted Value |
|---|---|---|---|---|---|
| 1 | 22.3 | 2.60 | 24.90 | 10.1 | 32.4 |
| 2 | 20.7 | 2.70 | 23.40 | 10.1 | 30.8 |
| 3 | 11.4 | 2.80 | 14.20 | 10.1 | 21.5 |
| 4 | 8.5 | 2.90 | 11.40 | 10.1 | 18.6 |
| 5 | 6.7 | 3.02 | 9.72 | 10.1 | 16.8 |
| 6 | 6.4 | 3.15 | 9.55 | 10.1 | 16.5 |
| 7 | 5.3 | 3.28 | 8.58 | 10.1 | 15.4 |
| 8 | 4.7 | 3.43 | 8.13 | 10.1 | 14.8 |
| 9 | 3.2 | 3.60 | 6.80 | 10.1 | 13.3 |
| 10 | 2.5 | 3.78 | 6.28 | 10.1 | 12.6 |
| 11 | 2.5 | 3.97 | 6.47 | 10.1 | 12.6 |
| 12 | 2.1 | 4.19 | 6.29 | 10.1 | 12.2 |
| 13 | 2 | 4.44 | 6.44 | 10.1 | 12.1 |
| 14 | 1.2 | 4.72 | 5.92 | 10.1 | 11.3 |
| 15 | 1 | 5.03 | 6.03 | 10.1 | 11.1 |
| 16 | 1 | 5.39 | 6.39 | 10.1 | 11.1 |
| 17 | 0.8 | 5.19 | 5.99 | 10.1 | 10.9 |
| 18 | -0.5 | 4.29 | 3.79 | 10.1 | 9.6 |
| 19 | -1.2 | 3.95 | 2.75 | 10.1 | 8.9 |
| 20 | -2.6 | 2.91 | 0.31 | 10.1 | 7.5 |
| 21 | -3.5 | 2.30 | -1.20 | 10.1 | 6.6 |
| 22 | -4 | 2.06 | -1.94 | 10.1 | 6.1 |
| 23 | -4.1 | 2.21 | -1.89 | 10.1 | 6 |
| 24 | -4.1 | 2.53 | -1.57 | 10.1 | 6 |
| 25 | -4.4 | 2.65 | -1.75 | 10.1 | 5.7 |
| 26 | -6.3 | 1.28 | -5.02 | 10.1 | 3.8 |
| 27 | -6.7 | 1.20 | -5.50 | 10.1 | 3.4 |
| 28 | -7.2 | 1.10 | -6.10 | 10.1 | 2.9 |
| 29 | -8.6 | 0.25 | -8.35 | 10.1 | 1.5 |
| 30 | -9.1 | 0.00 | -9.10 | 10.1 | 1 |
| Total | 40 | 90.9 | 130.9 | 303 | 343 |
The final sum of ‘premium’ dollars for catchers is $90.9 or $3 a catcher with the $1+ catchers at an average premium of $3.70 and the negative catchers at $2.28 (with the last catcher warranting no premium). I could see spreading these averages across all the catchers versus a dynamic premium which would be very difficult to maintain during a draft.
That is FAR less than the $300 combined premium ($10 per catcher) proposed by the traditional method.
One additional advantage for the thrifty catcher buyer is that at least a handful of snake drafters wait until the absolute end to draft their 2nd catcher (or leave $1 in auctions). Just timing your 2nd catcher buy makes it quite easy to avoid the full $10 penalty. In LABR, I drafted Dioner Navarro in the 28th of 29 rounds after I had already taken 5 reserve picks but before 4 other teams took their 2nd catcher.
As for inflation, that is driven by the draft room participants’ feelings on ‘insurance’ as well as their player assessments. So if everyone had the same assessments plus fully believed in insurance, I would expect the ceiling would be the $10 premium.
Below please find the 31 catchers drafted in my 2016 LABR mixed draft with their pick number, the $ value I have that pick worth, my player value, and the observed premium (pick value minus player value). Note that I have pick values go into negatives once we get into reserve rounds as I value picks by matching the pick number to the person in the player rater with that overall rank.
| Name | Pick # | Pick Value | Player Value | Premium |
|---|---|---|---|---|
| Buster Posey | 21 | 28.6 | 22 | 6.6 |
| Kyle Schwarber | 50 | 21.5 | 20.4 | 1.1 |
| Jonathan Lucroy | 93 | 15.4 | 6.4 | 9 |
| Russell Martin | 107 | 14.6 | 4.5 | 10.1 |
| Brian McCann | 114 | 13.9 | 8.3 | 5.6 |
| Salvador Perez | 124 | 12.3 | 11.2 | 1.1 |
| Travis d’Arnaud | 125 | 12.3 | 5.2 | 7.1 |
| Matt Wieters | 134 | 11.5 | 0.7 | 10.8 |
| Stephen Vogt | 156 | 10.3 | 2 | 8.3 |
| Yasmani Grandal | 159 | 10 | 1.9 | 8.1 |
| Devin Mesoraco | 165 | 9.7 | 2.4 | 7.3 |
| Yan Gomes | 170 | 9.3 | 0.9 | 8.4 |
| J.T. Realmuto | 181 | 8.8 | 2.3 | 6.5 |
| Francisco Cervelli | 213 | 7.3 | -2.7 | 10 |
| Welington Castillo | 214 | 7.2 | 1 | 6.2 |
| Nick Hundley | 223 | 6.9 | 6.3 | 0.6 |
| Derek Norris | 226 | 6.8 | -1.4 | 8.2 |
| Blake Swihart | 235 | 6 | -0.7 | 6.7 |
| Wilson Ramos | 239 | 5.8 | 3 | 2.8 |
| Miguel Montero | 250 | 5.3 | -3.6 | 8.9 |
| Yadier Molina | 278 | 3.3 | 3 | 0.3 |
| Robinson Chirinos | 292 | 2.4 | -4.2 | 6.6 |
| Jason Castro | 319 | 1.3 | -4.1 | 5.4 |
| James McCann | 329 | 1 | -4.2 | 5.2 |
| A.J. Pierzynski | 335 | 0.7 | -6.8 | 7.5 |
| Dioner Navarro | 408 | -2 | -7.4 | 5.4 |
| JR Murphy | 411 | -2.1 | -6.4 | 4.3 |
| Carlos Perez | 413 | -2.3 | -7.2 | 4.9 |
| Josh Phegley | 421 | -2.6 | -8.6 | 6 |
| Chris Iannetta | 427 | -2.8 | -10.7 | 7.9 |
| Hank Conger | 432 | -2.9 | -10 | 7.1 |
| All | 7.0 | 0.8 | 6.3 | |
| Top 16 C ($1+) | 12.0 | 6.7 | 5.4 | |
| Bottom 15 C (<$1) | 2.3 | -4.8 | 7.1 |
As you can see, the actual market premium on catchers was about $6.30 (note there’s some rounding differences in the table) and only $5.40 for the catchers I valued at $1+. The reason we don’t see a $10 premium is two-fold: 1) Not everyone believes in the $10 premium and 2) My player values are different than other competitor’s values. So even if you think the ‘insurance’ is stupid, you can justify spending more on catchers solely because of this market inflation.
The two players I chose are in red (Hundley and Navarro). Hundley was one of a handful of catchers that were draftable at near my position-neutral value. I took a $5.40 hit on Navarro though it could have been just $4.40 but I liked Navarro’s per-game performance over JR Murphy and bought on the upside that he exceeds my projected playing time. The average premium I paid was a combined $3/catcher – 70% less than the traditional method implies but right in line with my ‘insurance’ model.
So my suggestions for 2 catcher premiums in mixed leagues are as such:
- Catcher Haters/Gamblers – I am in this camp. I do not want to invest a lot of money in catchers for various subjective reasons (injury prone, less reliable). I suggest no premium on catchers.
- Slightly Averse to Crappy Catchers – I would follow the ‘insurance’ model where you would add about $3-4 (or 30-40% of the traditional method). You might jump a little quicker to get a catcher near face value.
- Really Averse to Crappy Catchers – I would follow the ‘inflation’ model and add about $6-$7 to catchers. This likely leads to picking two catchers in the first 2/3 of the draft. I do not recommend this but if this the market inflation rate on catchers, it is not unreasonable.
Does one gain a relative advantage vs competitors by having a rare positional star (e.g., Posey)?
If the hitter/pitcher values I noted above are representative, then the answer to this is no.
Believing one gains at an advantage with a ‘rare star’ requires there to be market inefficiency whereby certain positions are available on the ‘cheap’ in later rounds. But if I look at the spread from the best player available at a position to the last draftable one, you will find they are all around $30-$40 depending on the year (they can get to $40+ when a position has a Mike Trout/Bryce Harper or prime Miggy Cabrera as its leader).
When Buster Posey was chosen in the 2nd round of LABR by Howard Bender, he was forgoing the option of choosing a more valuable player (using position-neutral values). Let’s say he chose Edwin Encarnacion or Chris Davis to solidify 1B. Assuming he drafts Trumbo again in the 10th round, we then swap out the choice of Mitch Moreland in the 18th round for Yadier Molina. I have Encarnacion/Davis a few bucks more valuable than Posey and Moreland a few bucks more than Molina.
In this case, there is no advantage or disadvantage because all 4 picks in this example (Bender’s actual two, my substituted two) are reasonably valuable picks at those draft slots. I am not arguing that taking Posey there was a bad decision, it’s just that whatever advantage he gained in having a much better catcher than the rest of us was negated by having Mitch Moreland vs a better 1B/3B. This is why I typically view most misguided ‘scarcity’ plays to be benign (and bristle when I hear/read scarcity used to gush over a pick).
It is possible – depending on your draft room – that the premium on a ‘rare star’ might be less than on second/third-tier players. In LABR, I think Mike Podhorzer got a very good (pre-Fowler) price on Kyle Schwarber in the 4th round. One of the best catcher values in the draft. No better or worse than my Nick Hundley pick based on my values – it really comes down to drafting preference (and I prefer to wait on catcher and have some reservations on Schwarber). But the timing in the draft where these catcher values occur are going to vary by year (and, possibly, by draft).
Conclusion
‘Position scarcity’ in mixed league fantasy baseball drafts is largely an illusion except for 2 catcher leagues. In 1 catcher mixed leagues with typical roster formats, you should not even worry about positional adjustments and treat every hitter position-neutral (possibly adjusting up for multi-position and down for DH). In 2 catchers leagues, some adjustment could be made to catchers but it should be much less dramatic than the traditional method of ‘worst catcher value’ * -1 + 1 (e.g., worst catcher worth -$7 means a premium of -$7 * – 1 + 1 = $8). Based on my analysis, I’d put it at 30% of that figure.
Yes, it means you’ll have some draft-worthy players valued at less than $1 (particularly in 2 catcher leagues). But the alternative (significantly goosing up the values of all players at the position) distorts your rankings/values and could lead to making sub-optimal draft decisions (i.e., drafting catchers early – or paying more in auctions – thinking you are getting a discount when you should be diligently shopping for the best possible bargain).
Other Notes
- This analysis was based solely on standard 5×5. While I do not employ any positional adjustments (besides the mild one on catchers) for the other category variations I publish, it is certainly possible that some category combinations might disrupt the harmonic balance seen above. For instance, if you play 6×6 and add in SLG, you are tipping the balance towards power hitters which would help certain positions vs others. I would do an exercise like I did above for your format to determine if any adjustment is necessary but, when in doubt, do not make any adjustments. (Note: Our Preseason Player Rater accommodates a number of different league formats. If you don’t see your format in there, try the ‘Other Hit’ and ‘Other Pitch’ options.)
- If another player valuation system paints a different picture for 5×5 – e.g., the floor/replacement OF is significantly better than the floor/replacement SS – there are many reasons why this could be the case. Here are some helpful things to consider: Does the total $ for all players valued $1+ come close to $260 * # of starting players? Have you checked to see that the values for each stat category sum up to about the same number? If you are doing your hitter comparisons only within position (vs all rostered hitters like myself), try either re-running it based on only the players at that position that your first run deemed as rosterable or re-running it based on all rosterable players. If your system is dependent on a dynamic replacement-level value (e.g., the 19th 2B), take a long hard look at the differences per position and ask yourself if the differences really mean anything when you can suddenly add/remove a player (say, out for the year) and it changes by a couple dollars. (as a case study, check out the FanGraphs calculator which, as of this post, suggests for NFBC format that 2Bs should get a SMALLER positional adjustment than 1B or OF.)