
The below serves as a Frequently Asked Questions section for Razzball’s Historical Fantasy Baseball Player Rater. See here for a less comprehensive introduction. If you have a question not answered below, please post it in the comments.
1. General Info
2. Methodology
3. Use of The Data
What is the Historical Fantasy Baseball Player Rater?
A trivial exercise to determine the fantasy baseball dollar value for every player season since 1903.
Why would you take on this trivial exercise?
1) I like the history of baseball, baseball statistics, and fantasy baseball
2) The methodology was pretty much all in place for our Fantasy Baseball Player Rater (where we produce Pre-Season, Season to Date, and Rest of Season Player Rater values updated daily during the season)
3) To add perspective to current day performance (e.g., how (un)precedented is Miguel Cabrera’s 2012/2013, where did Chris Davis’s HR total rank all-time for fantasy value?)
4) A bigger data set to test future methodological changes.
5) A blow against constipation and stoicism (i.e, for shits and giggles)
What fantasy baseball categories are used?
The standard 5×5 categories – Runs, HR, RBI, SB, and AVG for hitters and W, SV, ERA, WHIP, and K for pitchers
What fantasy baseball format is this based on?
This follows the standard 12-team MLB format with ESPN/CBSSports rosters:
- 12-team mixed league Roto (where top team in a category gets 12 points, the worst gets 1 point)
- C/1B/2B/SS/3B/Corner Infielder/Middle Infielder/5 OF/Utility Hitter/9 Pitchers
- Standard budget of $260.
- Since the number of MLB teams has grown from 16 to 30 teams, the number of fantasy teams in a given season is adjusted based on the following formula: MLB Teams * 12/30 – e.g., in 1930 when there were 16 teams, Point Share values would be based on 6.4 fantasy teams (0.4 of a fantasy team is a lot easier to model than in practice although I’ve seen plenty of owners accomplish this by giving up around Memorial Day)
Can you add row numbers/ranks?
We are working on this.
Will you be adding historical player pages?
We do not have plans as of now to expand our player pages beyond current players. We are planning on incorporating all past seasons into the player pages.
Will you be adding a fantasy baseball hall of fame?
Maybe. If we do, though, it will likely be automated based on set criteria. A career fantasy valuable cutoff of $200 (only including $0+ seasons) would lead to a similar # of hitters vs pitchers (about 150 to 60) that are currently found in the HOF. The only exception I can see right now is to discount Saves/Reliever $ for pre-1947 pitchers as certain pitchers’ career values (Waite Hoyt, Charlie Root, Chief Bender) seem inflated.
How do you sort/filter the data?
Please see the instructions above and below the reports.
How do I see all of a player’s seasons?
There is no direct method right now to see all of a player’s seasons. For those in the Hall of Fame/Hall of Merit, you can see all player seasons on their respective links (just filter the name). The ‘best season by decade’ charts will have at least all the $0+ seasons for players. For hitters, there is a 300 plate appearance minimum (200 for 1981 and 1994). For pitchers, most SP seasons of $0+ will be at least 100 IP.
Can I get access to the whole data set (e.g., via Excel, CSV) ?
This is not available currently but we may be able to accommodate some requests. E-mail [email protected] with your request and planned use of the data.
Methodology
What is the methodology for valuing players?
The foundation behind the Historical Player Rater values is our Point Share methodology. WTF is a Point Share you ask? It represents the estimated difference in an average team’s points if they were to substitute a given player for the average drafted player at his position (same in concept as Alex Patton’s Standings Gain Points). So if a player has a 1.0 for Runs, he would, on average, increase a team’s standing points in Runs by 1 point. Thus, a completely average player is worth zero Point Shares.
Point Shares are converted to fantasy dollars via a series of steps:
- Create a universe of rostered players based on the most valuable players available at each position. MI, CI and Utility slot are divvied up based on most valuable players remaining at those positions after filling the initial slots. There is a fixed mix for SP/RP that varies by era depending on MLB reliever usage.
- Determine a replacement level (which will be negative since zero is average) and add its absolute value to the Point Share totals of all players (e.g., if replacement value is -2.9, add 2.9 to every player’s PS total)
- Divide the sum of Point Shares by # of Fantasy Teams * 260 to determine the $ value of a point share
- Multiply the adjusted Point Shares by the $ value of a Point Share.
What is the hitter vs pitcher distribution of the $260?
The distribution is done proportionally. Since there are 13 hitters vs. 9 pitchers, hitters get 13/22 * $260 ($153.6) and pitchers get ($106.4).
A key difference in estimating a player’s actual value vs. predicting his value before the season is that we have full knowledge of hitter/pitcher performance and, thus, there is no reason to discount pitchers. It has been historically easier to project hitter vs. pitcher performance and, thus, this distribution should be skewed towards hitters when working with projections.
Why are you only showing the $ translations of the Point Shares vs. showing the Point Shares?
For a given year, Point Shares provides a common metric to understand the relative values across players and stat categories. The fantasy dollar translations serves a similar ‘common metric’ purpose and it becomes a matter of preference on which metric to use in the reports.
When comparing against multiple years, however, the challenge is that a Point Share is not a common metric because it is scaled to the number of MLB teams. A Point Share when MLB has 16 teams (1903-1960) is worth almost 2x the value of a Point Share when there are 30 teams. Since the $ budget stays constant at $260/team, the $ translations of each category serve as a better reporting metric across multiple years.
How do you factor in positional value and assign positions?
Hitter value is based 75% on the average drafted hitter at his position and 25% on the average drafted hitter. Pitcher value is based 85% on the average drafted pitcher at his position (SP vs. RP) with Saves based 100% on position. Here is a ‘sniff test’ we did on these factors a couple years back.
Batting average, ERA, and WHIP contributions are adjusted based on a player’s AB/IP (i.e., the more AB/IP, the greater a positive/negative impact it has for a fantasy team).
Position eligibility for hitters follows the fantasy baseball standard (outside of Yahoo) of 20+ games at a position in the prior year. The data I had did not distinguish games played at a positions vs ‘starts’ so it is based on games played. Positions are also credited if they play 20+ games in the reported season. This threshold is considerably lower than generally considered in baseball and does lead to some surprising position assignments like Jimmie Foxx having 4 years at Catcher and Matt Williams having 2 years at Shortstop.
Position eligibility for pitchers is more subjective given the shifting roles of relievers over the years. In general, any pitcher whose GS represent 50+% of Games is noted as a SP as well as any pitchers with 20+ GS. All pitchers prior to 1921 are noted as ‘SP’ since the role of Relief Pitcher was not fully established yet.
Multi-position eligible hitters are assigned their most valuable position for Point Share calculations based on the following order of most valuable to least valuable: C, SS, 2B, 3B, OF, 1B, DH. It is possible that this order might slightly undervalue multi-position players during years where this order of offensive strength may not hold true in reality but the impact should generally be minor.
No additional credit is given to players with multi-position eligibility despite the fact that this does have inherent fantasy baseball value (e.g., even a Catcher with 1B eligibility adds some incremental value for the handful of games where a C is the best available free agent).
How do you account for hitting changes per era – e.g., low HRs/high SBs in early 1900’s, power spikes in the 1930’s and steroid era, etc.
All player seasons are compared to the average stats of that specific season. So Albert Belle’s 50 HRs in 1995 (when the average rostered hitter hit 18 HR) is worth more than Sammy Sosa’s in 2000 (when the average rostered hitter hit 23 HRs). Maury Wills’ 104 SBs in 1962 (when the average rostered hitter had 8.4 SB) is worth more than Rickey Henderson’s 100 in 1980 (when the averaged rostered hitter had 16.8 SB).
While this takes care of the vast majority of cases, there are a handful of instances with HR/SB where players are so far ahead of the pack that a cap is necessary to avoid overcrediting a player. Because no matter how much a player contributes in a category (say if Billy Hamilton steals 150 SB in 2014), he can only net you 12 points in SB (in a 12 team league). This cap has been set at 2/3 the number of fantasy teams which is higher than Point Shares should conceptually credit (since the comparison is the impact on the ‘average’ team, the max points should be at 5.5 points for a 12 team league – calculated as 12 being the category max and 6.5 being the average team’s points in a category) but lower than the absolute maximum which would be 11 points in a 12-team league (going from worst to first). This concession was made to make sure that in, say, 1927 that Babe Ruth’s 60 HRs would receive more Point Shares than Hack Wilson’s 30.
Twenty-six hitters between 1906 and 1931 hit the max in HRs Point Shares (Babe Ruth 10 of those times) and 4 hit the max in SB Point Shares (Maury Wills in 1962/1965, Lou Brock in 1974, Henderson in 1982). No batter comes remotely close to reaching the maximum in Runs, RBIs, or AVG since it is unrealistic for any player to be multiples ahead of the average player’s stats in these categories.
How do you account for pitching changes per era – e.g., 4-man vs. 5-man rotation, changes in SP innings pitched, etc.? (Note: Use of relief pitchers answered in a separate question)
The same logic applies here as described above with hitters. Everything is normalized for that specific year.
The same ‘2/3 of fantasy teams’ Point Shares cap is applied for pitching performance. The maximums were hit for the following player seasons:
K’s – 2 times (Dazzy Vance – 1924, Bob Feller – 1946)
Saves – 4 times (Joe McGinnity – 1904, Claude Elliott – 1905, Firpo Marberry – 1926, Joe Page – 1949)
How do you account for relief pitchers and Saves prior to the ‘closer’ becoming the norm?
There are two trends to consider here from the skewed perspective of a fantasy baseball retrostorian:
- The rate/frequency in which teams employed dedicated ‘relievers’
- The rate/frequency in which teams employed dedicated ‘closers’
Both of these trends drive how many (if any) relievers should be considered as part of the ‘rostered universe’ used to create positional averages. If relievers exist, they should be part of fantasy baseball (in my opinion). This is enforceable in practice through GS/IP limits or dedicated “RP” roster spots (like in Yahoo!). Since Saves are RP’s most valuable category, it stands to reason that their usage would increase as the number of closers/co-closers increase.
The below chart shows the increase in relievers and closers over the past 110 years. Relievers (green line) are defined as pitchers who started in less than 30% of their appearances and appeared in at least 30 games. Closers (red line) were defined as any pitcher with 10+ Saves.
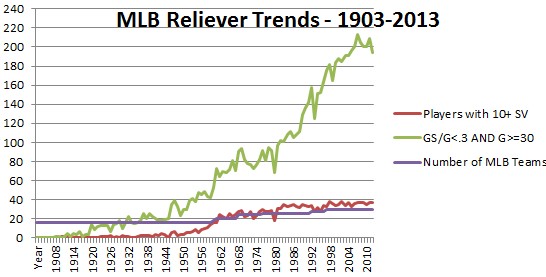
The first notable trend break is in 1921. From 1903-1920, only 33 pitchers ever qualified based on the aforementioned ‘reliever’ definition with no more than 7 in a single year (1917) . In 1921, 14 pitchers qualified as relievers and this number only dipped below 10 twice since 1921 (1922, 1927). In addition, ace relievers started to appear in the roaring 20’s like the immortal Firpo Marberry and Wilcy Moore (who was the second most valuable pitcher on the 1927 Yankees).
| Name | Year | Team | G | GS | IP | W | SV | ERA | WHIP | K |
| Firpo Marberry | 1926 | WSH | 64 | 5 | 138 | 12 | 22 | 3.00 | 1.35 | 43 |
| Wilcy Moore | 1927 | NYY | 50 | 12 | 213 | 19 | 13 | 2.28 | 1.15 | 75 |
| Firpo Marberry | 1924 | WSH | 50 | 15 | 195.3 | 11 | 15 | 3.09 | 1.33 | 68 |
| Garland Braxton | 1927 | WSH | 58 | 2 | 155.3 | 10 | 13 | 2.96 | 1.14 | 96 |
| Firpo Marberry | 1925 | WSH | 55 | 0 | 93.3 | 9 | 15 | 3.47 | 1.38 | 53 |
| Allan Russell | 1923 | WSH | 52 | 5 | 181.3 | 10 | 9 | 3.03 | 1.40 | 67 |
| Hub Pruett | 1922 | SLB | 39 | 8 | 119.7 | 7 | 7 | 2.33 | 1.32 | 70 |
| Rosy Ryan | 1922 | NYG | 46 | 20 | 191.7 | 17 | 3 | 3.00 | 1.40 | 75 |
| Watty Clark | 1928 | BRO | 40 | 19 | 194.7 | 12 | 3 | 2.68 | 1.25 | 85 |
| Rube Walberg | 1925 | PHA | 53 | 20 | 191.7 | 8 | 7 | 3.99 | 1.43 | 82 |
| Jakie May | 1926 | CIN | 45 | 15 | 167.7 | 13 | 3 | 3.22 | 1.31 | 103 |
| Rosy Ryan | 1923 | NYG | 45 | 15 | 172.7 | 16 | 4 | 3.49 | 1.24 | 58 |
The second notable trend break for this exercise is the jump in closers starting in 1963. The number of pitchers with 10+ SVs jumped to 24 in 1963 after slowly climbing from 10 in 1958, 11 in 1959, 14 in 1960, and 16 in both 1961 and 1962. While these increases are somewhat driven by expansion (16 teams prior to 1961, 18 in 1961, 20 in 1962-1963), 1963 marked the first year where the number of pitchers with 10+ SV is higher than the number of MLB teams. This ratio of pitchers with 10+ SVs and MLB teams stays relatively constant for the next 50 years while reliever usage skyrockets.
These two trends were used as guidance for determining the below distributions of SP vs. RP used in the Historical Fantasy Baseball Player Rater.
| Years | MLB Teams | Fantasy Teams | SP | RP | SP % |
| 1903-1920 | 16 | 6.4 | 58 | 0 | 100% |
| 1921-1960 | 16 | 6.4 | 47 | 10.6 | 82% |
| 1961 | 18 | 7.2 | 48 | 16.8 | 74% |
| 1962-1968 | 20 | 8 | 50 | 22.0 | 69% |
| 1969-1976 | 24 | 9.6 | 59 | 27.4 | 68% |
| 1977-1992 | 26 | 10.4 | 63 | 30.6 | 67% |
| 1993-1997 | 28 | 11.2 | 67 | 33.8 | 66% |
| 1998 and later | 30 | 12 | 71 | 37.0 | 66% |
Given the lack of ‘closers’ pre-1970s, reliever values (as well as early era SPs who doubled as occasionally firemen) should be taken with a few grains of salt. This just felt like a better solution than something more drastic like removing Saves or not introducing relief pitchers until more recent years.
How do you account for the fact that baseball was not integrated until 1947, Hispanic participation has skyrocketed in the past decades, Asian participation, etc?
The lack of African-Americans in 1903-1946 is accounted for by taking Negro League data and using a translation process to convert that into expected MLB performance while at the same time adjusting Caucasian performance down to account for increased competition. Hispanic and Asian participation were modeled using Census figures and current rates of Major Leaguers as a percentage of those country’s populations. Satchel Paige’s 1945 is the top ranked….
Oh wait, I didn’t do any of that. I wish I could wipe away the racial injustice of the past and retro-speed up globalization but that would require some quantum leaps (and I’m no Sam Beckett). BUT, I do use Jackie Robinson’s rookie year of 1947 as the dividing line for the modern era.
Why does your methodology compare vs. the average player value vs. the replacement value (like WAR)?
This is rooted in the different objectives of valuing a player’s real vs fantasy value.
The WAR framework (implemented differently by Baseball Reference, FanGraphs, and Baseball Prospectus) boils down all player contributions (hitters and pitchers) to Runs based on the calculated average value of events such as walks, singles, doubles, triples, HRs, and GIDPs (e.g, a HR is worth about 2 runs on average where a double is worth about 1.3 runs). This Runs total is adjusted based on park factors and subtracted from a modeled ‘replacement value’ for that player’s position(s) and then divided by a Runs per Win factor (generally 10 runs = 1 win) to calculate WAR. (See Wikipedia entry for WAR)
This is an awesome framework IMHO.
Unfortunately, fantasy value cannot be boiled down to one statistic. It can be boiled down into Standings Points but each of the 5 categories contribute exclusively to Standings Points (e.g., you cannot get more than 12 points no matter how many HRs your team hits or SBs your team steals). Without a lowest common denominator across categories, it is more difficult to determine the contribution of a hitter ‘replacement’. For instance, in 1980, below are various OFs that are worth $0 or less and, thus, would be the equivalent of replacement players.
| Name | Team | $ | PA | AB | R | HR | RBI | SB | AVG |
| Wayne Nordhagen | CHW | 0 | 428 | 415 | 45 | 15 | 59 | 0 | 0.277 |
| Ken Landreaux | MIN | -0.2 | 530 | 484 | 56 | 7 | 62 | 8 | 0.281 |
| Barry Bonnell | TOR | -0.2 | 506 | 463 | 55 | 13 | 56 | 3 | 0.268 |
| Amos Otis | KC | -0.4 | 446 | 394 | 56 | 10 | 53 | 16 | 0.251 |
| Rick Peters | DET | -0.6 | 539 | 477 | 79 | 2 | 42 | 13 | 0.291 |
| Clint Hurdle | KC | -0.6 | 436 | 395 | 50 | 10 | 60 | 0 | 0.294 |
| Al Cowens | DET | -0.7 | 577 | 522 | 69 | 6 | 59 | 6 | 0.268 |
| Greg Luzinski | PHI | -0.9 | 438 | 368 | 44 | 19 | 56 | 3 | 0.228 |
| Carl Yastrzemski | BOS | -0.9 | 411 | 364 | 49 | 15 | 50 | 0 | 0.275 |
| Sixto Lezcano | MIL | -1.3 | 457 | 411 | 51 | 18 | 55 | 1 | 0.229 |
| Lee Lacy | PIT | -1.8 | 312 | 278 | 45 | 7 | 33 | 18 | 0.335 |
| Bobby Murcer | NYY | -1.9 | 342 | 297 | 41 | 13 | 57 | 2 | 0.269 |
| Billy North | SF | -2.1 | 498 | 415 | 73 | 1 | 19 | 45 | 0.251 |
| Harold Baines | CHW | -2.7 | 516 | 491 | 55 | 13 | 49 | 2 | 0.255 |
| Joe Rudi | CAL | -3.3 | 397 | 372 | 42 | 16 | 53 | 1 | 0.237 |
| Larry Herndon | SF | -4 | 517 | 493 | 54 | 8 | 49 | 8 | 0.258 |
| Bob Molinaro | CHW | -4 | 382 | 344 | 48 | 5 | 36 | 18 | 0.291 |
| Jeff Burroughs | ATL | -4.3 | 317 | 278 | 35 | 13 | 51 | 1 | 0.263 |
| Rudy Law | LAD | -4.5 | 415 | 388 | 55 | 1 | 23 | 40 | 0.26 |
| Hosken Powell | MIN | -5.1 | 520 | 485 | 58 | 6 | 35 | 14 | 0.262 |
The HRs vary from 1 to 19 and the SBs vary from 0 to 45. So let’s say you average a number of them together to create a composite ‘replacement player’. This composite average for SB will vary greatly depending upon the inclusion/exclusion of Billy North and Rudy Law. An additional flaw is that any replacement average fails to consider the SBs for all the rostered OFs. Billy North’s 45 SBs look great from the POV of 2013 but their impact would have been blunted in 1980 by other teams having Rickey Henderson (100), Ron LeFlore (97), Omar Moreno (96), Willie Wilson and Dave Collins (79) .
By using ‘average’ instead of ‘replacement’, we can see that the average SBs per rostered hitter for 1980 (16.8) is considerably higher than 2013 (10.8) and can better estimate the impact Billy North’s 45 SBs will have in the Roto Standings.
Two additional notes:
- A ‘replacement’ methodology for fantasy baseball implicitly assumes (in my opinion) that you are measuring the impact a player is having on a team in last place in a category. This is fine for estimating real value (the 1962 Mets and 2013 Astros provide a good barometer) as, again, you can convert everything into the lowest common denominator (Runs) and convert that into Wins. For fantasy value, this overstates the importance of a given player. Take Babe Ruth in 1921 when he hit 59 HRs and no one else hit 24 HRs. It is almost a certainty any team with Babe Ruth wins the HR category. But what is the opportunity cost of not having Babe Ruth? It’s not that you are guaranteed to finish last – it is just that you are guaranteed not to finish first. There is an equal probability you will finish 2nd, 3rd, yadda yadda yadda, last. The average of all these probabilities is right about at the ‘average’ (e.g., 6.5 points would be the midpoint in a 12-team league). Sure, Babe Ruth could turn the last place team in HRs to first but he also is worth only 1 point to a team that is 2nd in HRs. Comparing with ‘average’ value vs ‘replacement’ value better accounts for that reality.
- The construct of fantasy baseball rosters makes a ‘replacement’ methodology less optimal. In current MLB, 1B and OF are the strongest offensive spots with C and SS typically the weakest. This generally holds true if you look at only the top hitters, the average amongst starters, and the replacement level. If fantasy baseball rosters employed the same starting spots as an MLB team (e.g., 3 OF vs. 5 OF), then there would be a large inequity in the hitting talent available in free agency per position (e.g., the 13th best 1B or 37th OF are markedly better than the 13th SS or C). But the over-rostering of OFs (5 vs. 3) and the CI/MI spots chip away at this inequity. This inequity is further neutralized with the Utility slot which (typically) pulls disproportionately from 1B/OF. The end result is that the hitters available in free agency (i.e, the ‘replacement’ players) are a lot more converged in terms of position-agnostic fantasy value than you would find in real baseball. Thus, the ‘replacement’ level across positions has a smaller disparity when comparing ‘replacements’ vs comparing those on rosters. This disparity – which is not seen in real baseball – means that valuing by replacement underestimates the value of hitters in weaker positions (C,SS,2B) than stronger positions (1B,OF).
What are the biggest differences between WAR and your fantasy $?
In no particular order: 1) Fantasy disregards BB and treats doubles and triples no differently than singles, 2) Fantasy overvalues the importance of R/RBI/SB/AVG/W/SV, especially SB and SV, 3) WAR factors in defense and non-SB related baserunning, 4) Fantasy ignores park factors for hitters/pitchers and team defense for pitchers and 5) WAR is cumulative for a season so a player who plays only half a season would earn 1/2 the WAR of someone who played the full season with the same performance. Our fantasy $ are based on comparisons to full-season averages so players with significantly lower than average playing time/counting stats will be harshly penalized. (This is one reason why negative $ seasons are not included in the career totals). It is conceivable to add ‘replacement level’ stats to remove this penalty but it is complicated and does not account for the cost of carrying an injured/benched player on one’s bench.
What are the biggest differences between the Razzball fantasy baseball awards (MVFH – Most Valuable Fantasy Hitter, FantCy – Fantasy Cy Young, and Rotoids Relief Pitcher) vs. the real awards (MVP, Cy Young, Rolaids Relief Pitcher)?
For hitters, the MVFH places a MUCH greater value on SBs (e.g., 2013 Miguel Cabrera is the first MVFH season since 2004 with less than 16 SB). MVP voting and MVFH probably value HRs and AVG about equal with MVP voting giving more weight to RBI than MVFH.
For starting pitchers, the FantCy places greater value on K’s than the Cy Young. This distinction is smaller now than in the pre-sabermetrics days. It’s almost impossible to win the FantCy right now without winning either the AL or NL Cy Young.
For relief pitchers, the Rotoids Relief Pitcher award probably focuses a bit less on Saves vs. the other 4 stats. A clear example of this is in 2012 when Jim Johnson won the AL Rolaids Relief Pitcher award but the fantasy $ awarded Fernando Rodney’s 2/48/0.60/0.78/76 with $21.5 and Jim Johnson’s 2/51/2.49/1.02/41 a $14.8. Johnson’s $1 advantage in Saves were negated by $2+ dollar differences in ERA/WHIP/K’s.
Does your methodology use z-scores?
No, it does not. (If you don’t know what a z-score is, no need to read further.) Many ‘player raters’ employ z-scores and it would be my recommended methodology to anyone who wants to DIY fantasy baseball player values because it is simpler to implement and can more dynamically determine the distribution of player stats in a given category. But I find that z-score methodologies tend of distort the contributions in certain categories vs. others (notably SB and SVs – see ESPN Player Rater for this in practice). I also find it difficult to convert z-scores into $ values (it’s certainly possible though).
Point Shares uses a fixed percentage per category to model the expected distribution in a given category using the compiled positional average as the midpoint. This category distribution percentage has been tested against our commenter league final standings over the past couple years. It would be difficult to impossible to prove these distributions hold true going back to 1903 so I am enlisting faith and/or willful ignorance on this topic.
So while I imagine a z-score methodology could produce something comparable (or better depending upon the producer) than my methodology, I went down a different path.
Why do certain categories seem to contribute more Point Shares/$ than others?
This has to do with both the variance in individual performance as well as the impact this has on the modeled Roto Standings. In general, the following categories are the easiest to ‘lap the field’: K’s, SVs, HR, and SB. The other statistics have lower ceilings for reasons such as: 1) a great player’s AB/IP is generally close to the ‘average’ and, thus, their AVG/ERA/WHIP impacts are watered down by the rest of a fantasy team, 2) there is a general constraint on how many R/RBI a player can get (e.g., easier to get 100 SB than 200 Runs), and 3) there is a general constraint on the number of Wins an SP could get.
Let’s use Pedro Martinez’s amazing 1999 as an example when he had 213.3 IP/23 Wins/0 SV/2.07 ERA/0.92 WHIP/313 K’s.
The average rostered SP in 1999 had a line of: 205.3 IP/13.6 Wins/0 SV/4.181 ERA/1.359 WHIP/150.6 Ks
On the surface, it’s hard to tell which one of his stats is most awesome. His ERA is less than half the average! His K’s are double the average! His WHIP is ungodly. Almost 10 more Wins!
A Point Share for SP Wins and Strikeouts in 1999 was 4.3 and 41.66 respectively. Subtracting his totals vs. these averages (plus, some adjustment for relievers which will funk up your math so take my word on this) and you end up with 3 Point Shares in Wins ($10.5) and 4.9 in K’s ($15.7). In other words, if you swapped Pedro in for an average SP like Jeff Weaver, you are going to gain nearly 8 points in the standings on Wins and K’s alone. The reason K’s are higher (and have the potential to be higher) is that there’s a general ceiling on the number of Wins a pitcher can get in a year (only 4 pitchers have more than 23 wins in a season since 1991 with the highest being Justin Verlander’s 26 in 2011). Strikeouts, however, have less of a ceiling and an amazing pitcher like Pedro or Randy can run laps around other pitchers even within the constraints of the 5-man rotation. Pedro would have needed about 31 Wins in 1999 to get the same number of Point Shares he earned in K’s.
The ERA/WHIP contributions – which involve subtracting the average pitcher’s IP and ER from a modeled team average and swapping in Pedro’s – result in Point Share contributions of 2.6 ($9.4) and 3.2 ($10.9) respectively. These don’t come close to his K value even though they are amazing ratios AND in a year where offense was high. The only recent pitching year that approaches his great (but not unprecedented) 1999 K contribution was Pedro’s 2000 when he had a 0.74 WHIP ($15.1).
Why does the sum of the category $ figures not equal the player’s total $ value?
The value of a replacement player is set at $1 so you’ll need to take the sum and add an extra $1. Rounding might lead to slight differences as well.
Why do most SPs get about $2 for Saves when they don’t have any Saves? (Note: Fixed for 2014 – will be addressed soon for past months)
There are two factors here. The first is that the Point Shares for Save are calculated based 100% against positional average – e.g, SPs against SPs, RPs against RPs. This is done because the current model estimates about 6 SP and 3 relievers per team for a 12-team league. With this average mix, there should not be anything more than fluke saves left in free agency. In essence, there is no opportunity cost for Saves if every closer is already owned. Since SPs no longer get any Saves, the average for the position is typically zero and every SP gets 0.0 Point Shares. If one was to create a position agnostic rater of pitchers, it would penalize SPs for their lack of Saves but would also boost their Wins/K’s and multiply their ERA/WHIP contributions (for the better or worse).
The second factor is how Point Shares are converted to $. A 0.0 in Point Shares is average and average is worth more than $0. So when this 0.0 is converted to $, it receives the value one would get for being average in a category.
If this ~$2 was not credited to Saves, it would likely be distributed to SPs in some other fashion since the sum of the rostered pitcher universe – even with this $2 gift – is about equal to the sum of attributed pitcher $ ($260 * 9/22 * number of teams). So this should not be deducted from the pitcher total $.
How do you factor in streaming pitchers/hitters?
This is not factored into Player Rater projections due to its complexity. It is possible – with more research – to perhaps determine the general category strength/weaknesses of a streaming strategy to develop category weights (my recent experience is that it is much harder to stream AVG than the counting stats and that streaming SPs all depends on owner preference but that the default practice is to maximize ERA/WHIP and compensate for the lack of K’s with middle relievers. This is tougher to employ in a IP cap league though).
How could Barry Bonds 2001 (129/73/137/13/.328) not be rated higher?
Bonds’ $41.6, while the best for 2001, is not only a few dollars shy of being in the top 20 of modern times (from 1947) but it is only the 4th best amongst Bonds’s (Barry’s 1990 and 1993, Bobby’s 1973).
There are three reasons for this: 1) OBP isn’t factored into these values, 2) Lack of SBs – Bonds stole 13 bases which only netted $1.7. He had $10.1 from his 52 SBs in 1990 and $4.7 from his 29 SBs in 1993. Bobby had $11.1 from his 46 SBs in 1973 and 3) 2001 was a ridunkulous offensive year so the value of his stats is muted – in fact, anything short of 73 HRs (which netted $17 which is the highest since 1990) would have dropped him behind Sammy Sosa (146/60/160/0/.328) and Alex Rodriguez (133/52/135/18/.318 at SS).
Why are only positive value seasons (>$0) included for career values?
The majority of negative seasons – particularly for star players – are either artificially low because of injuries or were when they were past their prime and no rational owner would own them. Seasons cut short by injuries would have led owners to fill in with a replacement (worth $0). There are very few cases where a player was so valuable that an owner would have held onto them the full year. Therefore, we feel it’s best to ignore those years with negative values.
Use of the statistics
Can I display/source this data on my website/blog?
Yes, we encourage you to reference all of these stats for articles, quizzes, etc. We just ask that: 1) You note it’s from Razzball, 2) Link to us, and 3) Do not copy/paste a big chunk of the stats on your site (i.e., showing a top 20 for a year or all the seasons for a single player is okay. showing every single player season for 1996 is not). If you run a baseball statistics site and are interested in integrating this into your player data, please e-mail [email protected] with your proposal.