Hit/pitch splits are commonly associated with fantasy baseball auction drafts auction drafts – e.g., spending $180 on hitting, $80 on pitching or 70/30 hit/pitch split. The discussions around hitting vs. pitching in snake drafts tend to be less mathematical in nature – often limited to debates on which round to draft one’s first starting pitcher and relief pitcher.
This post will demonstrate how to calculate hit/pitch splits for snake drafts as well as analyze 2013 Razzball Commenter League data to see what the most optimal hit/pitch splits are.
Part 1: Converting Draft Picks Into Dollars And Percent of a Team’s Budget
I estimated the value of each pick by tying it to the value seen in our Player Rater for that rank (so pick #1 = top ranked player). I ended up subtracting 1 from each spot so that the team totals neared $260 (came out at $255). The value of each fantasy baseball snake draft pick can be found here. I recommend ignoring the dollar estimates and just sum up the ‘% of Team Draft Value’ column.
Note: for those that like to create their own top rankings prior to a draft, this chart can help you understand whether your rankings have the intended hitter/pitcher skew. I showed the hit/pitch splits within various published rankings sources in my Fantasy Baseball Rankings Review for 2013.
Part 2: Analyzing 2013 Razzball Commenter League Data
Two caveats before you read further:
- This data is based solely on 2013. Every year is a bit different in terms of how players do versus pre-season expectations. Sometimes there are years where seemingly every reliever loses their job – other years they all do great. etc. While I do not think 2013 is particularly anomalous, that does not mean 2014 will play out exactly the same way.
- As an upcoming analysis will prove, active RCLers perform better than average (and vice versa for inactive ones). So some practices such as ‘punting SP’ may appear more successful based on the below analysis because they are disproportionately deployed by active players. The inverse may hold true for inactive players (including auto-drafters). I could/should have neutralized this potential bias but I realized it too late in the process.
Based on my values per draft pick, the max/min for hit/pitch split in a 13 hitter/9 pitcher/3 bench format like RCL is about 88% hitting/12% pitching (if you drafted hitting 1-17 and pitching at spots 18-25) and 25% hitting/75% pitching (if you drafted pitching 1-12 and hitting 13-25).
The below chart shows the results of all 768 RCL teams with the ‘x’ axis representing their % of draft invested in hitting and the ‘y’ axis representing their final standings points. The red data point is me. The yellow data point is Grey. The average hit/pitch split across all teams was 66/34 with a median of 66.5/33.5.
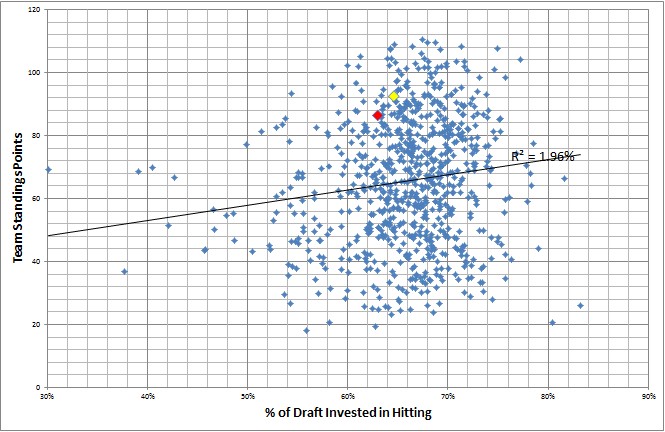
The trendline in the graph represents the ‘best fit’ if one was trying to predict a team’s standings points by the percentage of the draft they invested in hitters. The trendline here has a slightly upward slope indicating a slightly positive relationship – i.e., the more a team spent on hitting, the better they did in the standings.
If we focus on the teams that were within one standard deviation away from the median (60-71.8% hitting – roughly 3/4 of teams), the trendline is almost perfectly flat (see below).
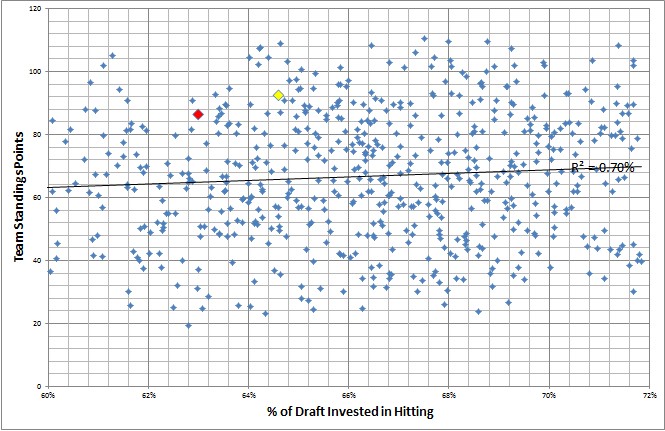
The 92 teams that invested less than 60% in hitting did fare worse (56 standings points) than the average team (65.5 points). The 85 teams that invested 72+% in hitting fared about average (65.8 points). Thus, it appears that based on 2013 data, there is very little impact in a team’s final standings based on drafted hit/pitch split as long as they clear 60% for hitting.
Before I show how this impacts hitting and pitching standings points alone, I think it is worth highlighting what I think is the biggest misconception involving snake draft hitting vs. pitching investments. While early rounds are disproportionately more valuable than later rounds, I think most drafters overrate the value of early rounds.
A telling example is comparing Grey’s draft vs mine in the RCL Experts league. I ended up drafting SPs in the 4th/5th round (Lee/F-Her) and my first RP in the 7th round (Chapman). Grey drafted his first SPs in the 6th/8th rounds (Greinke/Gallardo) and first RP in the 10th round (Holland). Given these differences, I think the common perception would be that I significantly over-invested in pitching compared to Grey. If we focus only on SP1/SP2/RP1, Grey had invested 15.5% of his overall budget while I invested 19.2%.
But once I grabbed F-Her and Chapman because I thought they were great values, I purposely pushed back subsequent pitching picks to solidify my offense. Grey ended up investing an extra top-11 pick on a pitcher (Niese). Thus, by the 11th round, Grey had actually spent more on pitching (20.4%) than myself (19.2%). I then spent my next 4 picks on pitchers (3 RP, 1 SP) while Grey only spent two of those picks on pitchers (1 SP, 1 RP) and that difference of about 6.3% of budget is what eventually led to my relatively small higher pitcher investment (63.7/36.3) than Grey (65.5/34.5).
| Grey’s Draft | Rudy’s Draft | |||
| Round | H/P | Pick Value % | H/P | Pick Value % |
| Hitting | 14 | 65.5 | 14 | 63.7 |
| Pitching | 11 | 34.5 | 11 | 36.3 |
| 1 | H | 14.3 | H | 14.4 |
| 2 | H | 9.0 | H | 8.9 |
| 3 | H | 8.3 | H | 8.4 |
| 4 | H | 7.2 | P | 7.1 |
| 5 | H | 6.7 | P | 7.0 |
| 6 | P | 5.9 | H | 5.8 |
| 7 | H | 5.6 | P | 5.6 |
| 8 | P | 5.2 | H | 5.2 |
| 9 | P | 4.9 | H | 4.9 |
| 10 | P | 4.3 | H | 4.2 |
| 11 | H | 4.0 | H | 4.1 |
| 12 | P | 3.5 | P | 3.5 |
| 13 | H | 3.3 | P | 3.4 |
| 14 | P | 3.0 | P | 3.0 |
| 15 | H | 2.8 | P | 2.9 |
| 16 | P | 2.2 | H | 2.1 |
| 17 | P | 1.9 | H | 2.0 |
| 18 | H | 1.7 | H | 1.7 |
| 19 | P | 1.6 | P | 1.6 |
| 20 | H | 1.3 | P | 1.2 |
| 21 | P | 1.1 | H | 1.1 |
| 22 | H | 0.8 | H | 0.8 |
| 23 | P | 0.7 | P | 0.7 |
| 24 | H | 0.3 | P | 0.3 |
| 25 | H | 0.0 | H | 0.1 |
My point here is focus less about hard rules on when to draft your first SP/RP and more on making sure you maintain your desired hit/pitch split. If you go with Clayton Kershaw as your 1st or 2nd round pick, you will need to adjust your subsequent picks unless you are okay with a high overall pitcher investment. For instance, if I were to draft Kershaw, I would probably cap my SP investment at 4 and might not take my 3rd/4th SPs until past the 16th round.
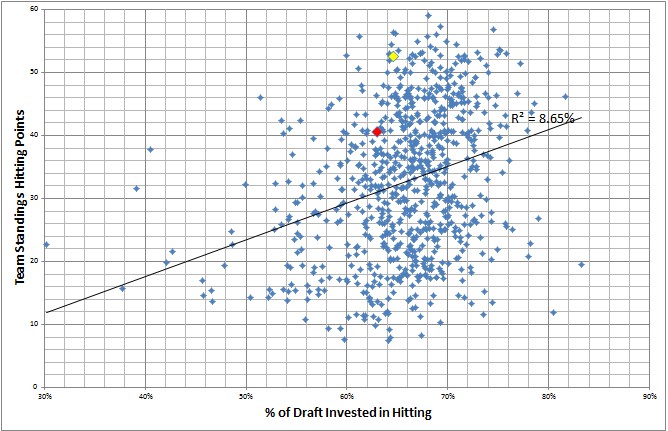
The below scatter graphs show the impact of the percentage invested in hitting against teams’ final hitting standings points and the same for pitching. Where there is a positive correlation for hitting ( R^2 of 8.65%=29% correlation), there is virtually no correlation when it comes to pitching (R^2 of 0.22% = 5% correlation). If I limited this to just those teams within 1 standard deviation of the median, the correlation %s would still show hitting to be greater (22% vs. 6%). This seems to confirm the common perception that hitting is ‘more reliable’ than pitching…..but I am not so sure.
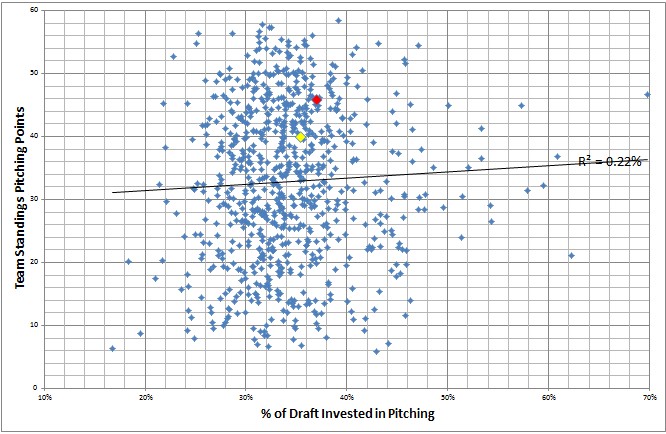
In the 2013 Fantasy Baseball Rankings test, the pitcher pre-season rankings actually correlated a little better with the end of season results than with hitters. This seemingly negates the ‘hitters are safer’ argument. So why does pitching make for a poorer investment?
My hypothesis on seeing the data was that this is caused by the ‘streaming effect’ – i.e., there are a higher percentage of pitching innings thrown by FA/waiver pickups (aka streams) than with hitter ABs. This ‘waters down’ the impact of drafted pitchers in relation to hitters. The fact that our Razzball Commenter Leagues use a GS cap vs an innings cap amplifies the ‘streaming effect’ because savvy RCLers pad their counting stats (and potentially help ERA/WHIP) with middle relievers.
Given that this phenomenon would impact SP value more than RP value, I ran the same analysis splitting out SP investment from RP investment. Wow! Starting Pitching investment is nearly the inverse of hitting – a negative 27% correlation (R^2 of -7.82%) with a team’s final standings points. When I narrowed the analysis down to those within 1 STDEV (18-30%) of the median (24%), the correlation only decreased to -18% (R^2 of -3.3%). The performance of the 50 teams with the heaviest SP investment was awful (average of 52 standings points, 13.5 below average) while the performance of the 50 teams with the lowest SP investment was strong (73.6 standings points, 8 above average).*
* REPEAT OF EARLIER CAVEAT (reads like that should rhyme) – I would bet that the low SP investors are much more active players than the high SP investors. As the red dot on the scatter graph shows, I veered slightly to the left of consensus in starting pitcher investment (by drafting only 4 SPs) but I am not a fan of relying as heavily on streaming pitchers as those to the left of me.
I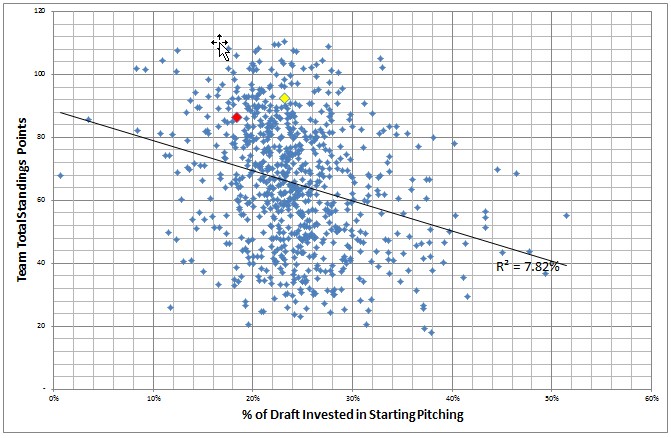
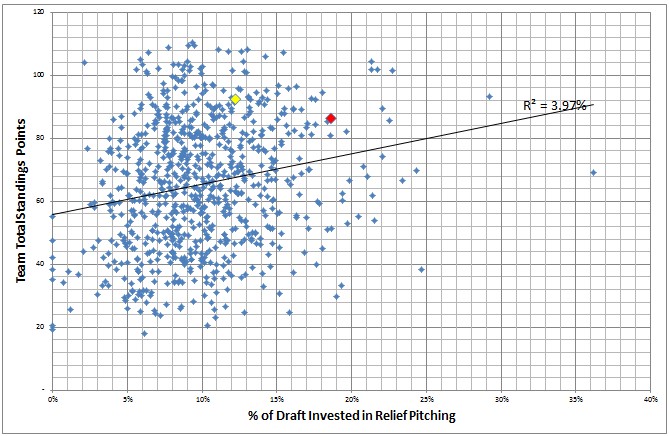
The story is the opposite for relievers. While they do not return the same level of investment (measured by standings points) as hitters (R^2 of 3.97% vs. 8.65%), they were a much better investment than starting pitchers. This strongly contradicts the ‘don’t pay for saves’ argument that I have disagreed with for years (here’s a post I wrote in 2008(!!!) on it). When narrowed down to those within 1 STDEV (5-14%) of the median (9%), the correlation decreased from 20.3% to 12.3% (R^2 of 3.97%). The teams who were the 50 heaviest investors in relief pitchers (me – in red – being one of them) averaged 70.7 points (5 above average) while the 50 lightest investors averaged 53.6 points (12 points below average). Those top 50 investors averaged 5.7 relievers where the league average was 3.7 relievers so it is as much about reliever volume as it is about quality (fwiw, i drafted 7 – Aroldis, Reed, Street, Jansen, K-Rob, Marmol, Al-Al)
Final Conclusions/Notes
- Converting draft picks into $/% of budget increases transparency as to how much you are investing in hitting vs pitching during snake drafts.
- When putting together rankings for RCL or leagues with similar formats, I suggest building your rankings with a 66/34 split so that it is easier to identify draft bargains. I will be moving to this in my pre-season rankings that I’ll be posting on this site (last year, I used 62/38 while Grey used 69/31).
- The common ‘sweet spot’ among RCLers is 60-72% hitting / 28-40% pitching. Within that range, there is very little difference in how teams performed. If you are going outside this range, it is better to be skewed toward hitting (72+%) vs pitching (>40%).
- The common ‘sweet spot’ among RCLers is 18-30% SP / 5-14% RP. Based on the findings above, it would be wiser for RCLers to err on the light side for SPs and heavy side for RPs.
- Given these correlations are not overwhelmingly massive, if you have a particular strength in terms of drafting (hitters vs SPs vs. RPs), I would follow it and only caution against investing too much in starting pitching.


