
In this series of Hall of Fame nomination-based posts, we’re going to focus on specific roles/positions. We’ll be reviewing both players on the HOF ballot as well as non-HOFers who we feel deserve re-consideration.
This third post focuses on starting pitchers – with Bert Blyleven (61.9%), Jack Morris (42.9%), and Tommy John (29.1%) the three with the highest % of votes from last year’s nomination. Before we even look at their stats (and those of other non-Hall of Famer contemporaries), we need to set the criteria by which to judge HOF-worthiness. The criteria by which starters have been judged has been preoccupied by counting stats – primarily Wins but also Strikeouts tend to be considered (think Ryan, Carlton, part of Blyleven’s argument). Let’s first review modern pitchers in the HOF to determine what criteria seems to define excellence – with a bias towards those that factor out the bias of era, park, and team performance.
Here are the stats for starting pitchers with 200+ Wins since 1956 who are in the Hall of Fame (this factors out Koufax who had only 165 Wins):

The stats that best factor out the era/park/team performance biases are Quality Start % and ERA+. Quality Start % is the percentage of starts that went 6+ Innings and gave up 3 or less runs. While there is a bias here in that it was easier to give up 3 or less runs in ‘low offense’ years, it is a better statistic than Wins/Win % as it factors out team performance. ERA+ or Adjusted ERA adjusts a pitcher’s ERA according to the pitcher’s ballpark and the ERA of the pitcher’s league (100 is league-average). K/9 IP and K/BB ratio are good secondary measures to understand how dominant a pitcher was. WHIP (Baserunners/9 IP) is a great stat but has to be used directionally since it isn’t adjusted like ERA+.
I created composite stats based on the top 1/3, middle 1/3 and low 1/3 of these players – e.g., if you divide these players into 3 tiers, 314 wins represents the floor of that 1st tier.
If we look at these starters, we see all have Quality Start %s over 60%. ERA+ tends to be at least 15% above league average with Nolan Ryan, Don Sutton, and Catfish Hunter being the exceptions. If we look at just these two stats, it seems fair to say that the most questionable modern pitcher in the HOF is Catfish Hunter. His ERA+ of 104 is near league-average and that’s with less post-peak innings pitched than most since arm troubles and diabetes forced him to retire at 33. While Sutton’s ERA+ isn’t very impressive, his Quality Start % (aided perhaps by Dodger Stadium) looks mighty impressive. And Nolan Ryan’s strikeouts and no-hitters add enough intangibles to look past the ERA+.
So based on the above, let’s go with a 60% Quality Start % and a ERA+ of 115 as the tentative bar with Wins and K’s as secondary arguments.
Now, before we look at the eligible players, let’s apply this criteria against the dominant generation of pitchers that just retired or are nearing retirement:

The pitchers that are HOF locks – Randy, Pedro, Clemens, Maddux, and Glavine – easily hurdle this 200 Win, 60% QS% and 115 ERA+. I doubt I’ll be alone in marvelling at how impressive Curt Schilling and especially Kevin Brown stack up based on these criteria – if I’m still blogging in 5 years, expect me to be championing both their causes. It’s also interesting how the two other players on this list discussed for HOF – Smoltz and Mussina – pass these criteria while the four below the mark (at least on QS%) are generally considered below the bar. (Note: For David Cone fans, he had 194 Wins, 120+ERA, and a 61.6% QS%. Given the time lost at the tail end of his career due to his arm aneurysm, I can make an argument for him too…)
Okay, now let’s look at non-HOF pitchers since 1956 with 200+ Wins that are HOF-eligible (retired 5+ years):

One last chart before I go into each player. Since Wins are such a huge part of the debate, I calculated a metric called ‘Adjusted Wins’. For all I know, some sabermatrician did this already so I’m not going to say I invented it. To calculate ‘Adjusted Wins’, I first created a metric called ‘Wins Per GS / QS%’. This takes the % of starts that were Wins and then divides it by the % of starts that were Quality Starts. I ran this against the HOF bunch and it came out to an average of 73.1% (e.g., they had about 3 Wins for every 4 Quality Starts). I ran this against the HOF-eligible pitchers and it came out to 74.4%. Based on this, I created an Adjusted Win metric that is Quality Starts * 74%.
This metric has two inherent flaws:
- Not all Quality Starts are equal. Giving up zero earned runs in 9 IP is much more Win-worthy than a 6 IP / 3 ER start
- It doesn’t account for era or park bias (like ERA+). A Quality Start in a low offense era in a pitcher’s park isn’t as Win-worthy as the same one in a high offense era in a hitter’s park.
Nevertheless, I think this provides guidance as to whether a pitcher ‘deserved’ more or less Wins. The ‘Diff’ column is positive (blue) if the Adjusted Wins are higher than actual Wins and negative (red) if the Adjusted Wins are lower than actual.

Bert Blyleven – 62.6% of his starts were Quality Starts. His ERA+ was 115. His K/9 IP is better than 8 of the 13 HOFers listed earlier (bested by Ryan, Carlton, Gibson, Seaver, and Bunning) and everyone on this list except Chuck Finley and Mickey Lolich. His Wins per GS / QS% is at 66.9% which is well below the 74% average – leading to an adjusted win total of 317 (or 30 above actual). The only arguments I can see against Blyleven is that he didn’t ‘dominate’ his time – e.g., never won a Cy Young (top 7 four times) and only 2 All-Stars. I could see using this type of argument to separate borderline candidates but Blyleven is comfortably above the thresholds set by the pitchers already in the HOF.


Vote: YES
 Fun facts/anecdotes: The first and only great baseball player to be born in The Netherlands – unless you count Andruw Jones (who was born in Netherland Antilles). In 1986-1987 with the Twins, he gave up 50 and 46 Home Runs – setting a single-season record (50) and having the third highest total (Jose Lima’s 48 is 2nd). As an announcer, Blyleven loves to drop the f-bomb and, based on the adjacent pic, we imagine he has no compunction about dropping a Dutch oven on his sleeping partner – proof you can take a man out of the Netherlands but you can’t take the smell if you’re trapped under the sheets when that man farts.
 Jack Morris – The arguments for Jack Morris generally boil down to the following: ‘Best pitcher of the 1980’s”, “Three World Championships”, and “Big-game pitcher”. I imagine just about all the nominated Hall-of-Fame pitchers have similar superlatives. The only difference is that their statistics are clearly superior to Jack Morris.
Of those HOFers, the best comparison seems to be Catfish Hunter. Both were workhorses on generally good teams (Catfish won 5 Championships). Neither were big strikeout guys (Catfish 5.3/9 IP, Morris 5.8 K/ 9 IP). Both had ERA+s that are dangerously close to league average (Catfish 104/Morris 105). Catfish had a -6 in Adjusted Win Difference (won 6 more games than predicted) while Jack has a -34 (which is only bested by David Wells and Kenny Rogers among pitchers shown above). I’d argue here that Catfish shouldn’t be in the HOF rather than Morris should be in the HOF.
Let’s go back and compare him vs. the other non-HOF pitchers. His 56.4% QS ranks him near the bottom of the list. As does his 105 ERA+. And I already mentioned that his Win total is arguably as inflated than any other pitcher with 200 Wins since 1956. I don’t know…maybe he ‘gutted’ out a lot of 7 IP / 4 ER run games. But is there an argument that he had more ‘guts’ than the rest of these pitchers?
As for playoffs, his career playoff stats are 7-4 with a 3.80 ERA. Good, yes. Great, no. Four of these wins came in the 1991 Twins ALCS and World Series victories – the most famous of course being his 1-0 10 inning shutout against Atlanta in the 7th game. No doubt this was awesome and extremely memorable. He was also great for the 1984 Tigers going 3-0 with a sub-2.00 ERA.
Looking at those two playoff runs, you could forgive that he lost his only start for Detroit @ Minnesota in the 1987 ALCS (8 IP / 6 ER). But how about his 1992 playoff run for the Toronto Blue Jays – a team that gifted him 21 wins with his 4.04 ERA/102 ERA+? In 4 starts across the ALCS and WS, he went 0-3 with an 8.22 ERA. Toronto beat Atlanta 4 wins to 2 – Morris lost both of those games.
I’m not saying Jack Morris was a bad playoff pitcher – it is that he is remembered as better because of selective memory. For comparison sake, Dave Stewart went 10-4 with a 2.69 ERA during his playoff stints with Oakland and Toronto. John Smoltz went 15-4 with a 2.65 ERA. David Cone went 8-3 with a 3.80 ERA. Roger Clemens – who isn’t particularly regarded for playoff dominance – has a 12-8 record with a 3.75 ERA. Net-net, Morris was good in the postseason but not extraordinary (outside of that one start).
Lastly, I want to argue against the oft-repeated claim that he was the best pitcher of the 1980’s. This ‘best in decade’ argument is arbitrary to begin with – Mark Grace has the most hits in the 1990’s! Who cares? You can take any ten year period and find stats like that – it doesn’t make it any more relevant.

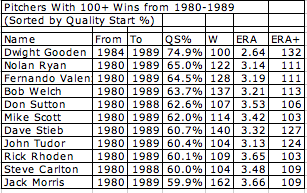
In any case, while Morris had the most Wins in the 1980’s, he was not the best pitcher. Dwight Gooden is clearly the best from 1984-1989 with a phenomenal 74.9% QS% and 132 ERA+. Dave Stieb bests Jack Morris in QS% (60.7% to 59.9%) and crushes him in ERA+ (127 to 109). Nolan Ryan, Fernando Valenzuela, Bob Welch, and John Tudor all best him in QS% and ERA+.
At the end of the day, an HOFer needs to exceed certain criteria in order to be enshrined. Based on 60+ QS% and ERA+ 115+, Morris doesn’t really come close. Based on all the other peripherals, he still doesn’t come close. Just because there weren’t a lot of starters whose peak was between 1980-1985 doesn’t change the fact that Morris was a good-to-very good pitcher and NOT a HOF-caliber pitcher.
Vote: NO
Fun facts/anecdotes: Jack Morris was definitely the most feared pitcher in his day…..by females in the media – as evidenced by this Jack Morris 1990 locker room gem to Detroit Free Press writer Jennifer Frey: “I don’t talk to women when I am naked unless they are on top of me or I am on top of them.”
 Tommy John / Jim Kaat – Tommy John – best known for a surgery (that really should be named after Frank Jobe who actually invented it) – often gets lumped in with Jim Kaat as both have 280+ wins and unimpressive winning percentages. On first glance, it’s easy to disregard them as pitchers who just pitched for a long time.
But let’s dig deeper. Tommy John has the edge on QS % (61.6 to 58.4) and adjusted ERA (110 to 107). Neither had impressive K/9 IP ratios (both below 5) or WHIPS (both above 1.25). Tommy John finished in the top 5 in league ERA 6 times, 4 time All-Star, and 4 times finished in the top 10 for Cy Young. Jim Kaat finished in the top 5 in league ERA 3 times, 3 time All-Star, and finished once in the top 10 for Cy Young.
The most surprising difference between the two are their Adjusted Win Difference – while Tommy John has a +31, Kaat has a -13. In other words, if both won 74% of their Quality Starts, Tommy John would lead in wins 319 to 270. While Tommy John notably pitched for the successful late 70’s Dodgers and 1979-1981 Yankees, he also had a number of years with mediocre to bad teams ranging from the White Sox, Indians, Angels, and even the Yanks (in his second tour of duty).  Jim Kaat spent the bulk of his career with the Senators/Twins (1959-1972) which had a number of strong Killebrew/Oliva led teams (incidentally, Kaat only led the team in ERA once during that period – Jim Perry had the top team ERA for 4 of those years).
I think the strongest argument against Tommy John is his 110 ERA+ and unimpressive WHIP. Given his low K-rate, these stats aren’t that surprising. But Tommy John was above average for enough years (besides the 61.6% QS%, he had 18 years with 150+ IP and 100+ ERA+, 13 years with 150+ IP and 110+ ERA+) that I think he warrants HOF nomination. It’s a close call, though.
As for Kaat, he falls below both the QS% and ERA+ thresholds and there isn’t much of a secondary argument for him that I can see.
Tommy John Vote: YES
Jim Kaat Vote: NO
Fun facts/anecdotes: Only Nolan Ryan (27 seasons) has pitched more seasons than John (26) and Kaat (25). Tommy John was successful in getting a surgery named after him but was unsuccessful in getting investors to finance his self-named port-o-potty. Jim Kaat finished his 25-year playing career with a 25-year broadcasting career. He plans on spending the next 25 years being that old guy by the Little League field who provides unsolicited and oft-ignored advice.
Rick Reuschel / Orel Hershiser – Who would have thought that Rick Reuschel would have the highest QS % out of this group? Not me. I just remember him on the Giants later in his career when he could go a whole game throwing a variety of mediocre fastballs and still win games. But there he is at the top with Orel Hershiser.
So both these guys pass the 60+ QS% threshold and by a significant amount (63.7% Reuschel, 62.9% Hershiser). That’s at or above Steve Carlton! In addition, both benefit from the Adjusted Win analysis that ekes up their Win totals to 249 and 217, respectively.
Their ERA+s fall just below the mark at 114 (Reuschel) and 112 (Hershiser). Their peripherals are just so-so – both had high WHIPS (greater than 1.25) and average K rates (below 6.0).
At the end of the day, I’d say both of these guys were very good pitchers and probably underrated (especially Reuschel) but fall below HOF-caliber. While Tommy John had 300+ Adjusted Wins, neither of these guys crack 250. If you’re going to go in with a ERA+ under 115, you at least need longevity on your side. For comparison’s sake, Tommy John had 700 GS. Blyleven had 685. Reuschel was at 529. Hershiser only 466.
Vote: NO
The Rest – No one else passes the QS % and ERA+ test. No one besides Tanana even passes 250 Adjusted Wins. All very good pitchers but none appear HOF-worthy.